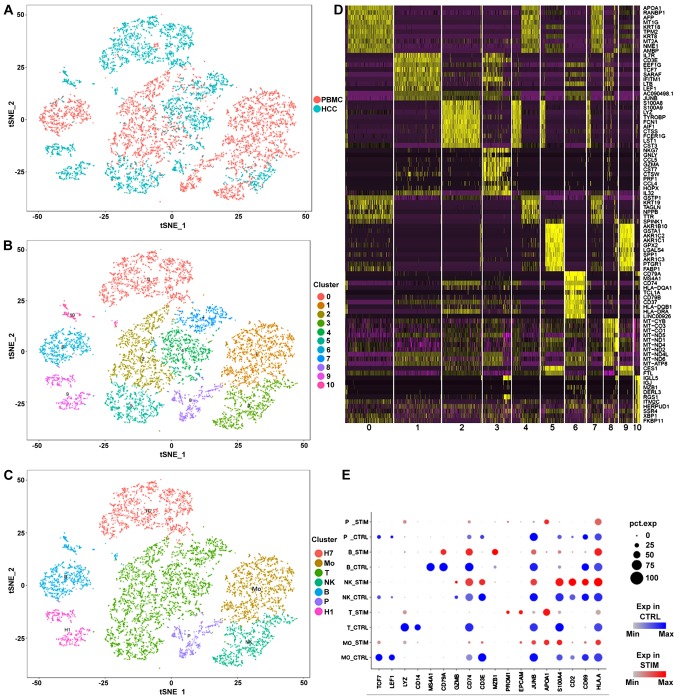
Figure 1.
Single-cell transcriptomic data of PBMCs, HCC tumor cells and liver cancer cell lines integration. (A) Integration of PMBC and tumor samples. (B) Identification of cell populations by PCA. (C) Definition of cell types according to the marker genes. (D) Heatmap of the markers identified by PCA. (E) Comparison between expression of marker genes in PBMC and tumor samples. The color blue indicates the expression levels in PBMC samples, the color red in tumor samples. The size of each dot represents the percentage of the cells that expressed the corresponding gene. H1, HuH1; H7, HuH7; Mo, monocytes; NK, natural killer cells; P, epithelial cells; T, T cells; B, B cells; PBMC, peripheral blood mononuclear cells; PCA, principal component analysis; STIM, tumor samples; CTRL, PBMC samples; HCC, hepatocellular carcinoma.

