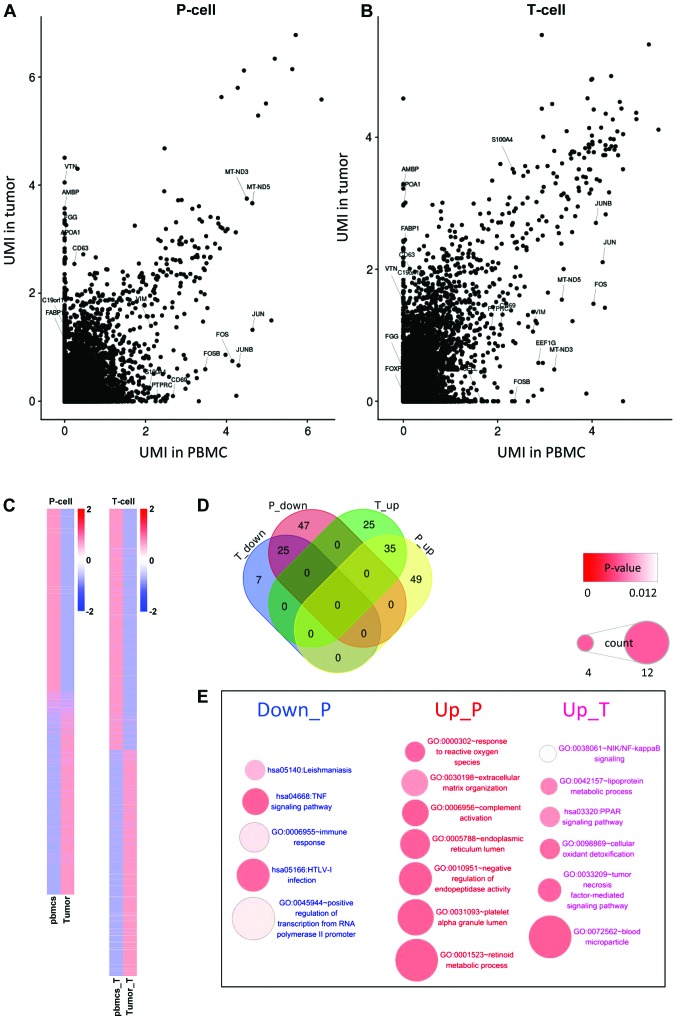
Figure 2.
Differentially expressed analysis in tumor cells and T cells. (A) A scatter plot of the gene expression correlation between tumor cells and vascular epithelial cells in the peripheral blood. (B) A scatter plot showing the gene expression correlation between T cells infiltrated in the tumor and T cells in the peripheral blood. (C) A heatmap of differentially expressed genes in the comparisons. (D) A Venn diagram of the number of the differential genes with |log2Fold-Change|>2 in the comparisons. (E) Enriched Gene Ontology terms and Kyoto Encyclopedia of Genes and Genomes pathways of these differential genes. UMI, unique molecular identifier; PBMC, peripheral blood mononuclear cells.

