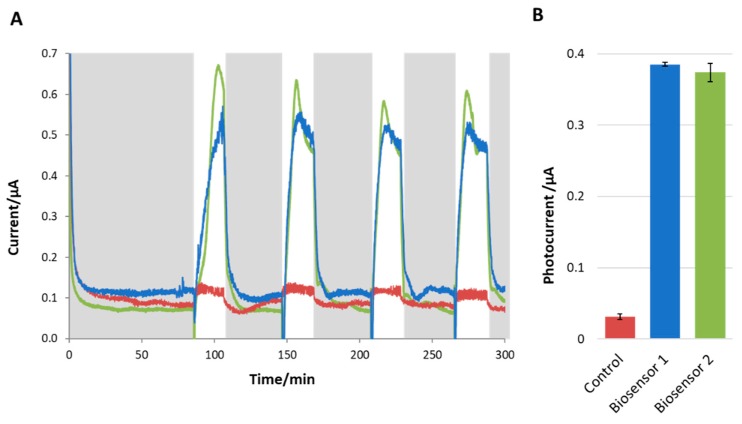
Figure 4.
(A) The current output response to light and dark conditions for the biosensor developed here is shown in duplicate (blue and green lines). The abiotic control is shown on the same graph (red line). The periods of darkness are indicated with grey backgrounds, whereas the white background indicates illumination. The biosensors showed a significant and consistent response to light (i.e., increase) and dark (i.e., decrease) conditions. Photocurrent is calculated as the difference between the stable current under illumination and the background current. Only a very small change in current on illumination was observed in the control, where the biological material was not present. (B) Histogram of the photocurrent produced by the biosensors (replicate 1 and 2) and the control. The error bars represent the standard deviation between the different illumination cycles of the same biosensor.

