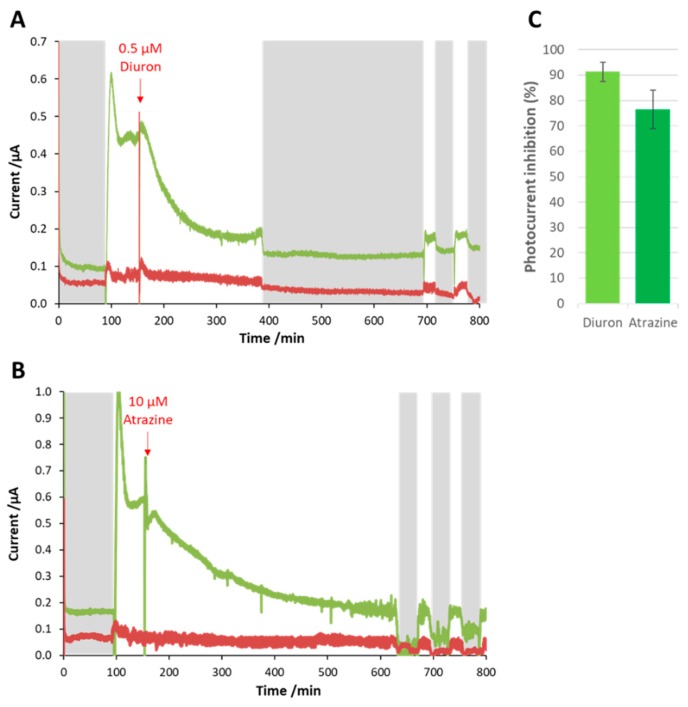
Figure 5.
Effect of diuron (A) and atrazine (B) on the photocurrent of the biosensor (green lines). The periods of darkness are represented with grey backgrounds. Under illumination, the current decreased as soon as the herbicide was injected. For atrazine the inhibition process was slower as compared with diuron even though the concentration was more than an order of magnitude higher. The currents measured for the abiotic controls are shown with red lines. (C) Shows the percentage inhibition of photocurrent in the two cases. The error bars represent the standard deviation for three different bioelectrodes.

