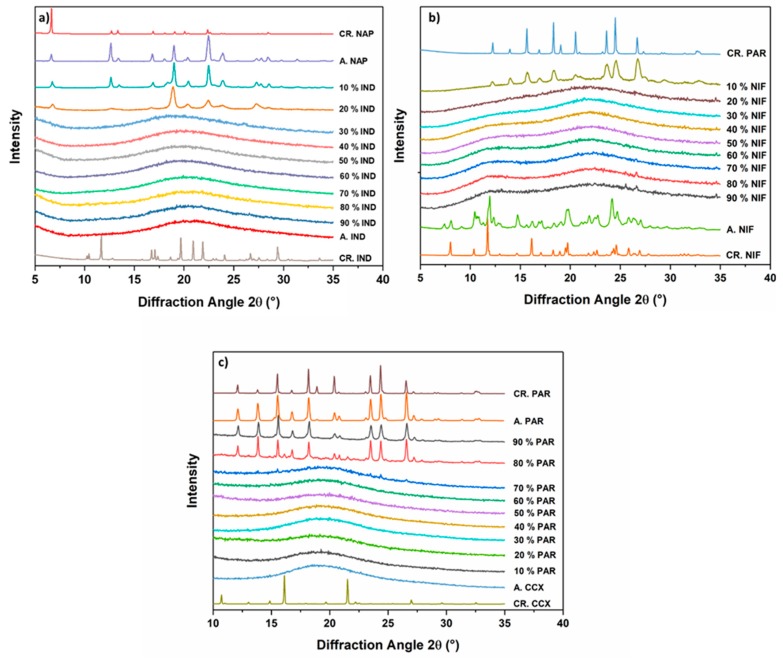
Figure 3.
Diffractograms of (a) IND-NAP samples, (b) NIF-PAR samples, and (c) PAR-CCX samples after melt quenching. Included are the diffractograms of starting materials (CR. NAP, CR. IND, CR. PAR, CR. NIF, and CR. CCX) and the single drugs after melting and cooling (A.NAP, A. IND, A. PAR, A. NIF, and A. CCX).

