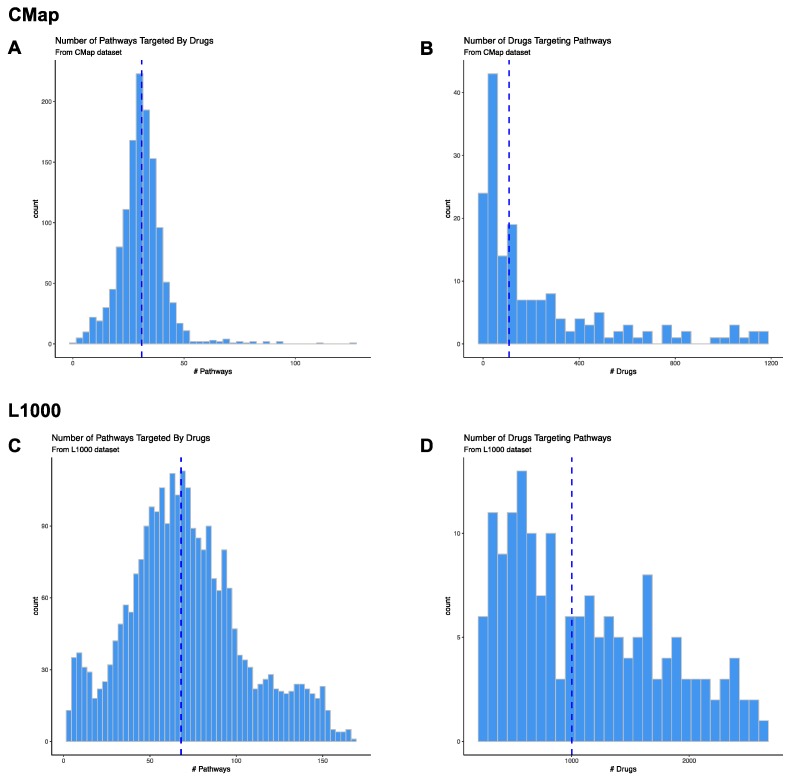
Figure 2.
Drug-Pathway Prediction Results. We determined whether genes within KEGG pathways (within the MSigDB v6.2 dataset) were significantly up-regulated or down-regulated by drugs in CMap and L1000 databases using Gene Set Enrichment Analysis (GSEA). We downloaded the drug gene expression signatures for CMap from ftp://ftp.broadinstitute.org/distribution/cmap/ (amplitudeMatrix.txt) and the L1000 signatures from Gene Expression Omnibus (Level 5 data; Phase I: GSE92742, Phase II: GSE7013). Histograms of the number of pathways predicted to be targeted by drugs in CMap (A) or L1000 (C) databases. Histograms of the number of drugs in CMap (B) or L1000 (D) databases predicted to target pathways. The blue dashed line represents the median number of pathways in A and C or drugs in B and D.

