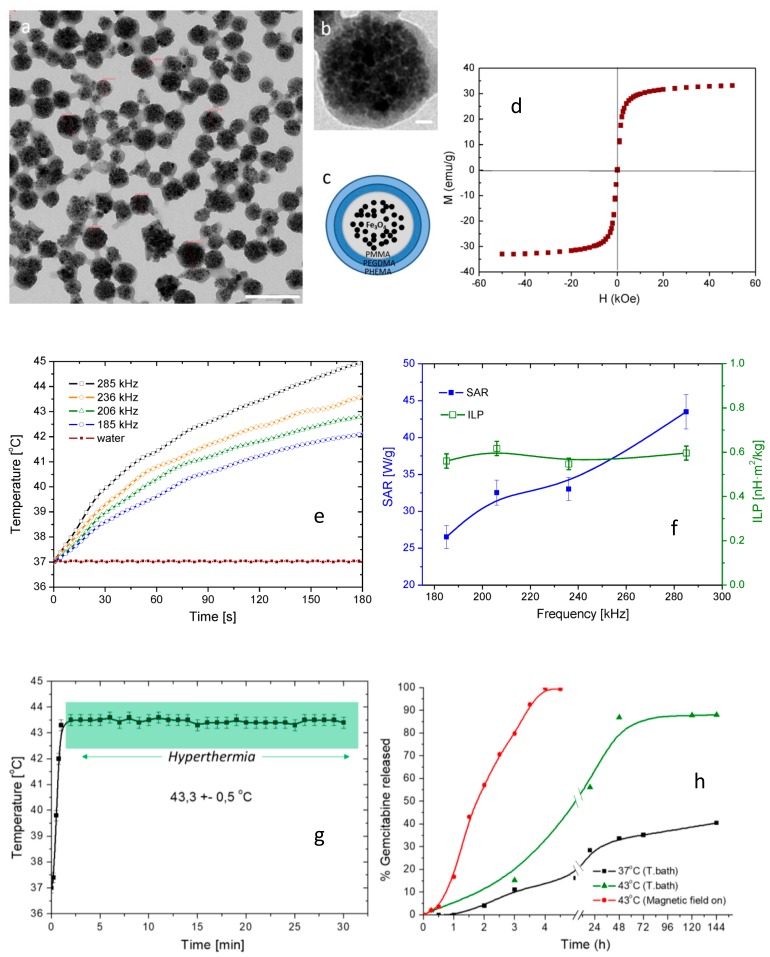
Figure 5.
MagP-OH particles: (a) TEM image, scale 200 nm, (b) TEM detail, scale 20 nm, (c) schematic representation of MagP, (d) magnetisation curve of MagP, (e) time evolution of temperature for various frequencies, (f) Specific Absorption Rate (SAR) and Intrinsic Loss Power (ILP) for Ha = 16.2 kA/m, (g) hyperthermia measurement, (h) drug release measurement; adapted from [242].

