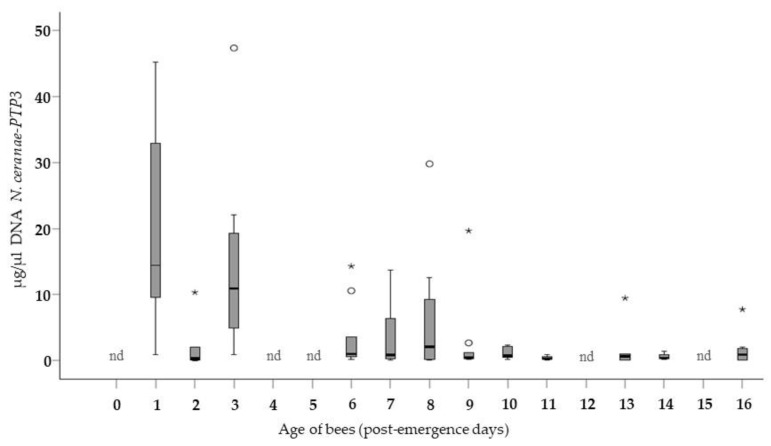
Figure 2.
Average concentration of the N. ceranae-PTP3 DNA (µg/µL) 7 days after the collective infection of the bees in Group B: *: extreme cases (any value > Q1 − 1.5 * IQR or > Q3 + 1.5 * IQR; Q: quartile; IQR: interquartile range). o: very unlikely cases (any value > Q1 − 3 * IQR or > Q3 + 3 * IQR; Q: quartile; IQR: interquartile range). Extreme cases and very unlikely cases were calculated separately within each age. nd: no data. As indicated, bees were exposed collectively to the N. ceranae spores on day 0 p.e. and analyzed 24 h later (after consuming the contaminated food).

