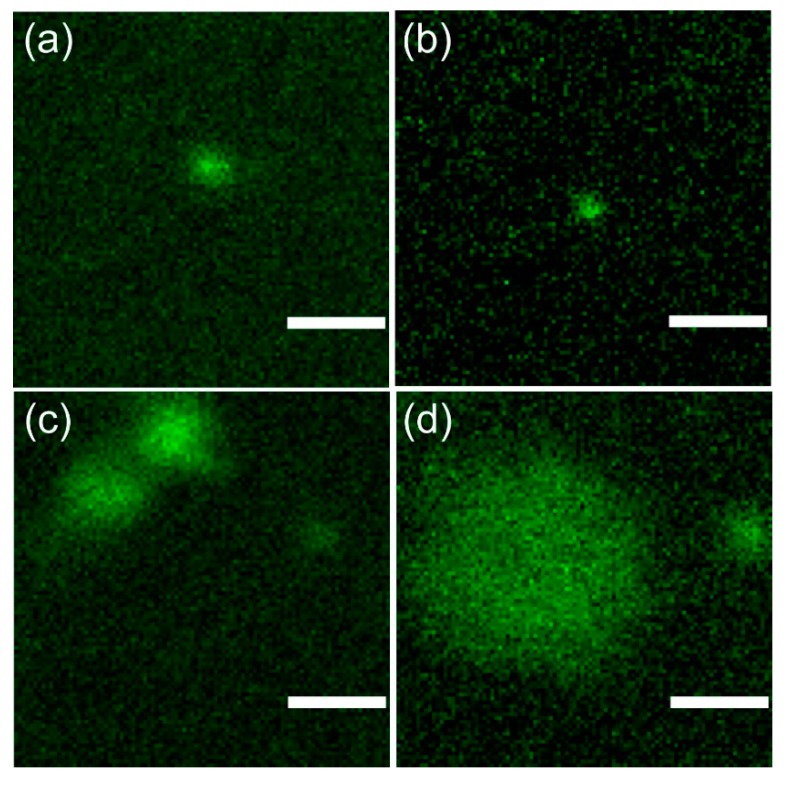
Figure 6.
Representative fluorescence confocal micrographs of NP. For all images, the same field of view and pixel size was adopted, to allow a direct visual comparison of NP size. (a) SB-Ch NP (sol state), (b) SB-Ch NP (gel state), (c) QA-Ch NP (gel state), and (d) QA-Ch-S-pro NP (gel state). Scale bar: 1 µm.

