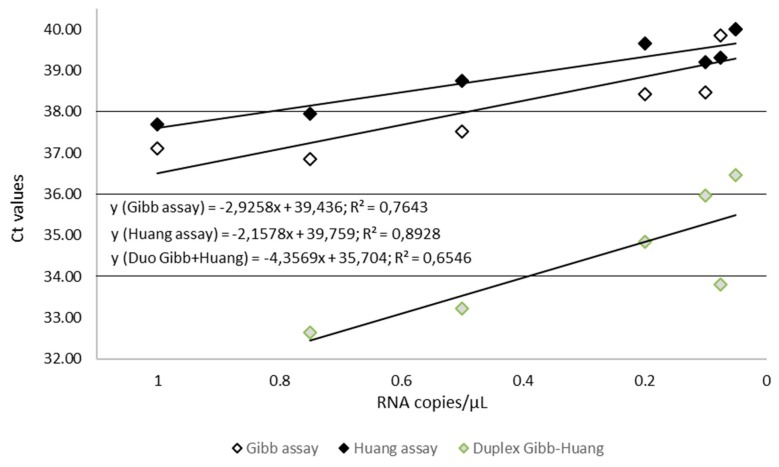
Figure 7.
Comparison of standard curves for Gibb, Huang, and Gibb/Huang assays using serial diluted EBOV RNA transcript, dilution range from 1 to 0.02 copy per microliter. The RNA copy numbers per reaction are plotted on the X-axis, and the cycle number crossing point values (Ct values) are plotted on the Y-axis. Ct, Cut-off threshold.

