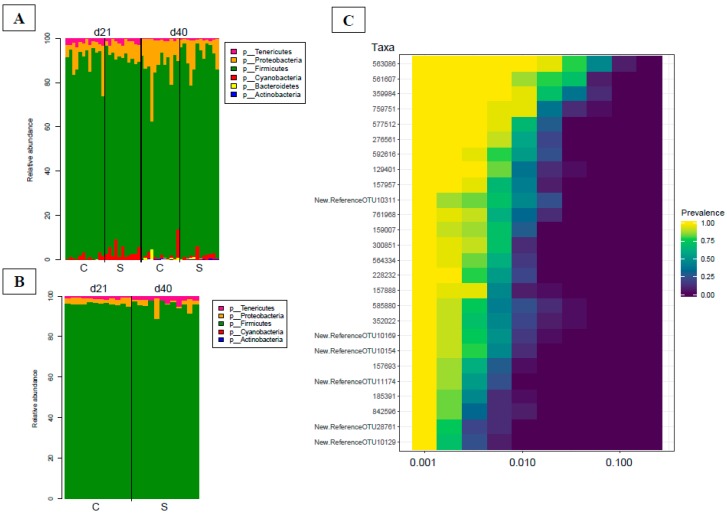
Figure 1.
(A) Bar plot of the main phyla detected in fecal materials on days 21 and 40, respectively; (B) Bar plot of the main phyla detected in cecal materials on day 40; (C) Heatmap of the cecal core microbiota of broilers. OTUs were shared by 99% of individuals in our cohort, with a minimum detection threshold of 0.001%. The x-axis shows the detection threshold of the core microbiota operational taxonomic units (OTUs) in our cohort.

