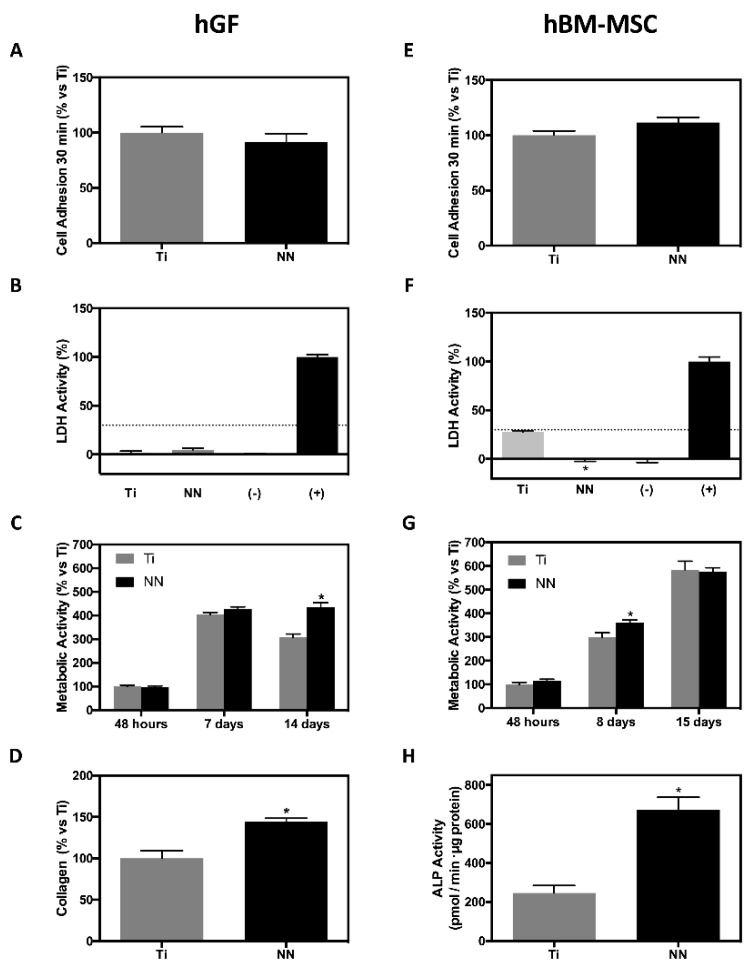
Figure 3.
Surface bioactivity on hGFs and human bone marrow mesenchymal stem cells (hBM-MSCs). The graphs on the left (A–D) represent hGFs’ response to NN surface (n ≥ 9) and the graphs on the right (E–H) represent hBM-MSCs’ response to NN surfaces (n ≥ 6). (A,E) Cell adhesion to the surfaces, expressed as % versus Ti. (B,F) Cytotoxicity of cells cultured on the different surfaces, measured as LDH activity; cells cultured on TCP are considered (-) and hGFs/hBM-MSCs treated with Triton X-100 1% are considered (+). Results are expressed as % versus (+). (C,G) Metabolic activity of cells cultured on the different surfaces over the time; results are expressed as % versus Ti. (D) Collagen deposition of hGFs cells cultured on the different surfaces for 14 days; results are expressed as % versus Ti. (H) ALP activity of hBM-MSCs cultured on the different surfaces for 15 days; results are expressed as % versus Ti. Results were statistically compared by Student’s t-test: * p < 0.05 versus Ti.

