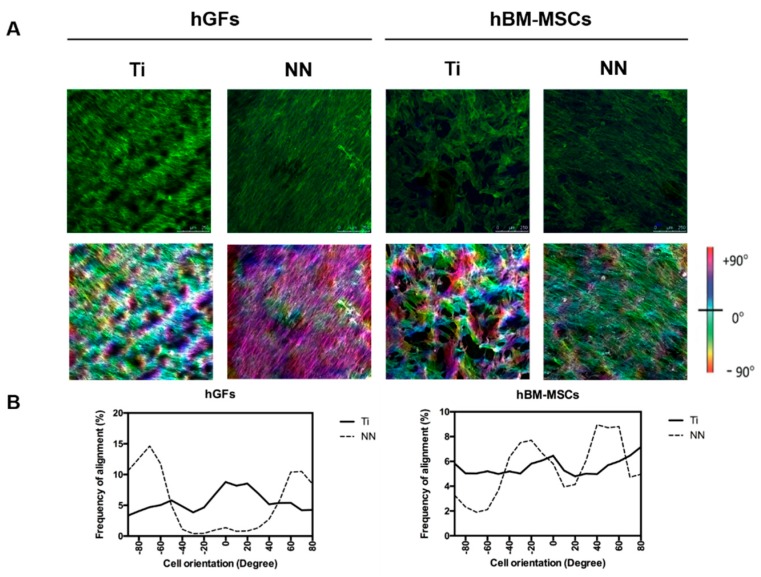
Figure 4.
Cell orientation on the nanostructured surfaces. (A) The images in the upper row represent hGFs and hBM-MSCs stained with Phalloidin-FITC (green) and DAPI (blue) (n = 2). Images in the middle row show actin fibers orientation degree with different colours through the surface analysed using ImageJ software. (B) The graphs represent the % of pixels in each orientation angle for both cell types for each surface.

