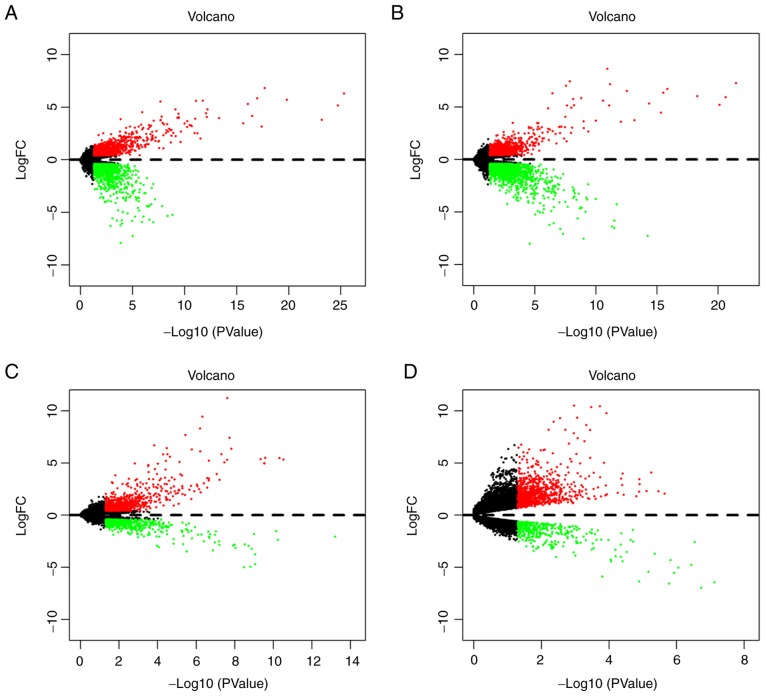
Figure 2.
Volcano plots of DEGs obtained from the T1-T4 subgroups. (A) DEGs between T1N0M0 and T1N1M0. (B) DEGs between T2N0M0 and T2N1M0. (C) DEGs between T3N0M0 and T3N1M0. (D) DEGs between T4N0M0 and T4N1M0. Red indicates upregulation in LNM and green indicates downregulation in LNM. DEGs, differentially expressed genes; FC, fold change; LNM, lymph node metastasis.

