Figure 4.
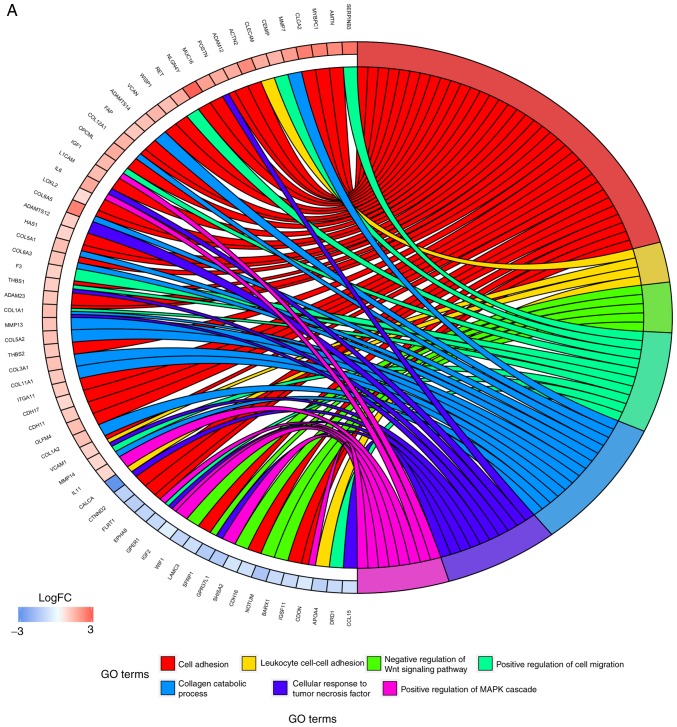
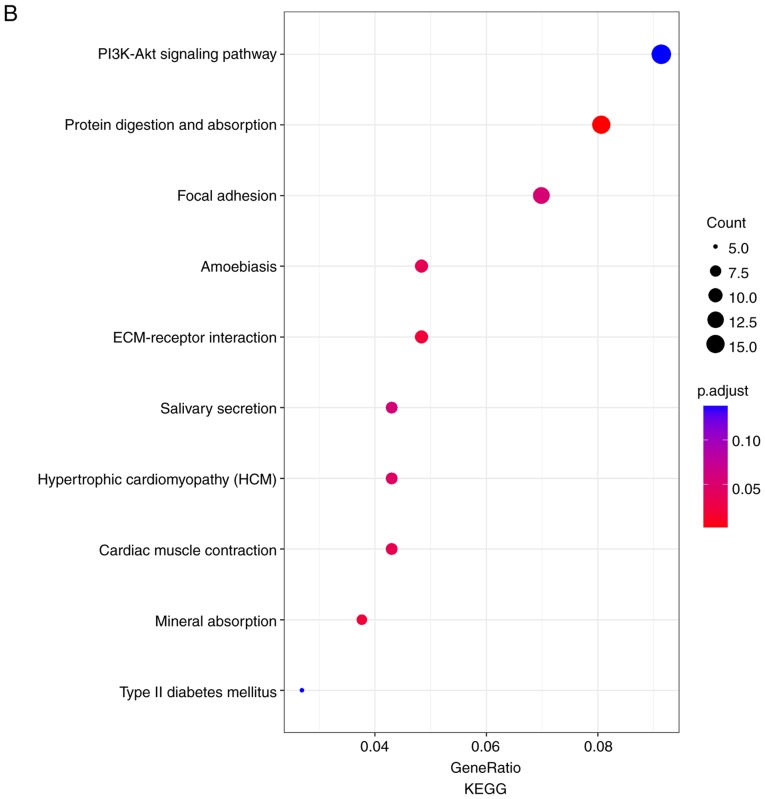
Results of GO enrichment analysis and KEGG pathway analysis. (A) GO enrichment analysis. Different colors on the right side of the image represent different GO terms, whereas the left side of the image represents the expression levels of the genes. Lines represent the associations between genes and corresponding biological processes. (B) KEGG pathway analysis. Size of the points represents the count of genes enriched in each pathway. Colors of the point represent the P-value. FC, fold change; GO, Gene Ontology; KEGG, Kyoto Encyclopedia of Genes and Genomes.


