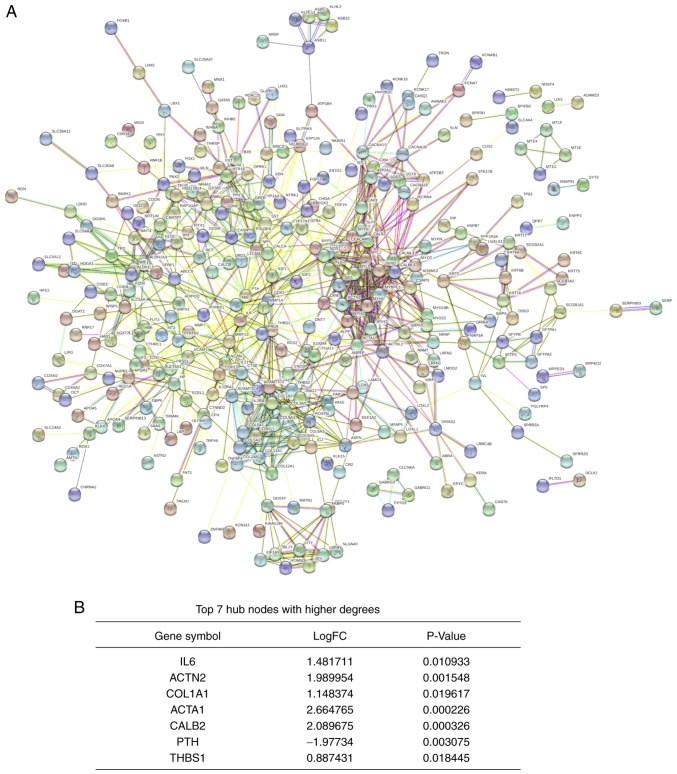
Figure 5.
PPI network for integrated differentially expressed genes and hub genes analyses. (A) PPI network. Circles represent proteins and lines represent interactions between proteins. The thickness of the line represents the significance of the interaction. (B) List of the hub genes. ACTA1, actin α1; ACTN2, actinin α2; CALB2, calbindin 2; COL1A1, collagen type I α 1 chain; FC, fold change; IL-6, interleukin 6; PPI, protein-protein interaction; PTH, parathyroid hormone; THBS1, thrombospondin 1.

