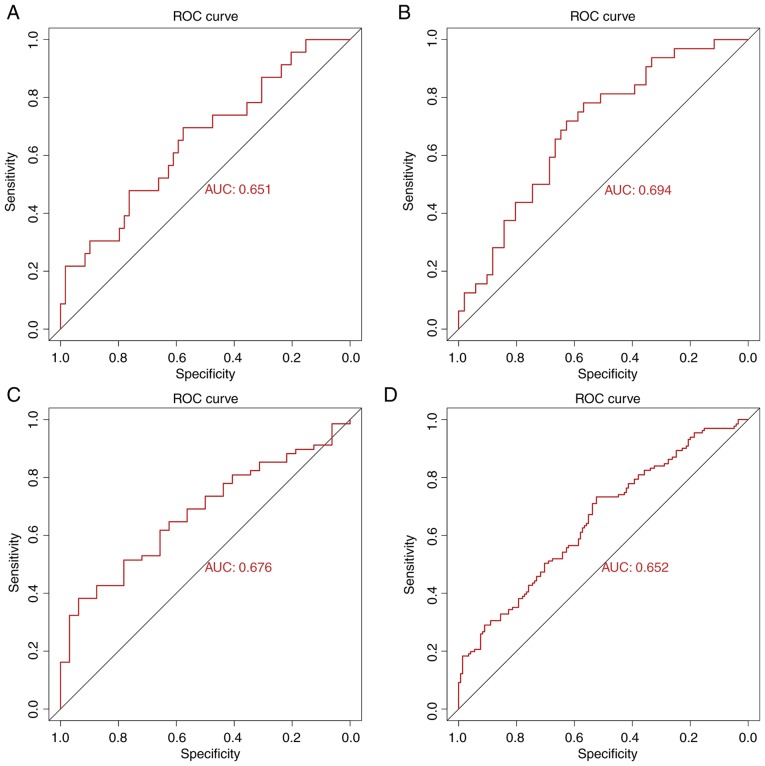
Figure 6.
ROC curves for the seven hub genes to predict LNM in TC obtained from the T1-T3 subgroups and all-samples group. (A) ROC curve for predicting LNM of TC had an AUC of 0.651 in the T1 group. (B) ROC curve for predicting LNM of TC had an AUC of 0.694 in the T2 group. (C) ROC curve for predicting LNM of TC had an AUC of 0.676 in the T3 group. (D) ROC curve for predicting LNM of TC had an AUC of 0.652 in the all-samples group. AUC, area under the curve; LNM, lymph node metastasis; ROC, receiver operating characteristic; TC, thyroid cancer.

