Figure 3.

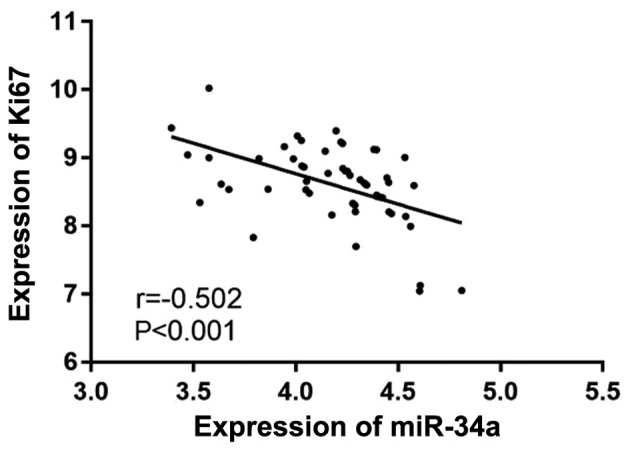
Correlation analysis of miR-34a and Ki67 expression levels. There was a negative correlation between the expression levels of miR-34a and Ki67 (r=−0.502, P<0.001).

Correlation analysis of miR-34a and Ki67 expression levels. There was a negative correlation between the expression levels of miR-34a and Ki67 (r=−0.502, P<0.001).