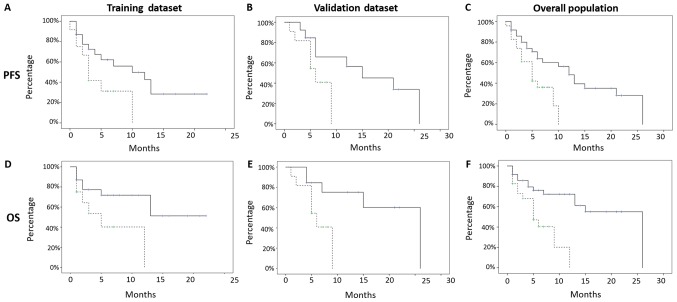
Figure 2.
Analysis of survival (OS, PFS) with texture score of the different subsets. PFS was significant for both subsets. (A) TRAINING SUBSET: Low risk PFS: Median PFS 10 months; mean 10.9 +/- 1.8 months; 95% CI 7–14 months; vs. high risk median PFS 3 months; P=0.044. (B) VALIDATION SUBSET: Low risk median PFS 15 months; vs. high risk median PFS 6 months; P=0.048. OS was significant for both subsets. (D) TRAINING SUBSET: Low risk median OS: Not reached; vs. high risk median OS: 5 months; P=0.023. (E) VALIDATION SUBSET: Low risk median OS: 26 months; vs. high risk median OS 6 months; P-value 0.032. The global texture score, which correlated with patients' survival, allowed the classification of these patients into two cohorts at low (Score 0–1; 36 patients; 61%) and high risk (Score >1; 23 patients; 39%). (C): WHOLE COHORT: low risk median PFS of 12 months, vs. high risk median PFS 5 months (P=0.009). (F) WHOLE COHORT: low risk median OS 26 vs high risk median OS 5 months (P=0.002).

