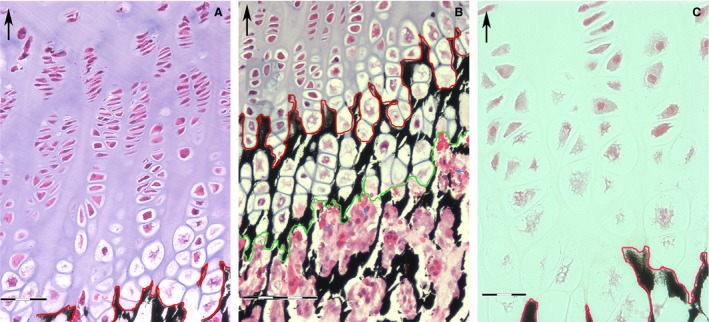
Figure 1.

Undecalcified section, Von Kossa‐haematoxylin‐eosin. (Top, left corner arrow = longitudinal tibial axis). (A) Progression of chondrocyte maturation cycle in the rabbit tibia proximal growth plate. The red line marks the front of mineral deposition. The hypertrophy of chondrocytes starts about 50 μm above the line of mineral deposition. Scale bar: 60 μm. (B) Zone of endochondral ossification: the red line marks the mineral deposition line and the green marks the vascular invasion line: this band of tissue has a regular thickness of about 100 μm and at this level the hypertrophic lacunae reach the largest expansion. No hypertrophic chondrocyte is found below the vascular invasion line; the lacunar spaces are filled by a pool of densely packed cell; capillaries are recognizable by the presence of erythrocytes. Scale bar: 100 μm. (C) Structural changes with fragmentation of the chondrocyte nuclear chromatin start to be observed above the line of mineral deposition. Scale bar: 30 μm.
