
Figure 7.
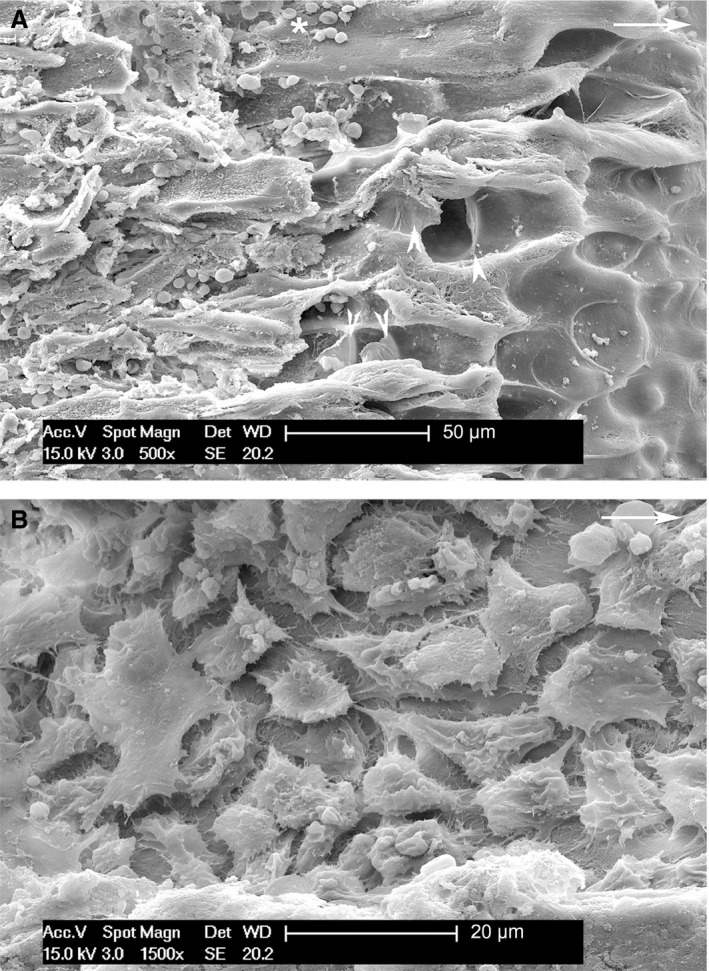
Longitudinal, fractured growth plate specimen processed for SEM (top right arrow = longitudinal tibial axis). (A) (SEI) The fractured surface exposed on the right‐hand side of the figure shows the tunnels of hypertrophic chondrocytes with the thin transverse septa (arrowheads). The left‐hand side shows the upper, vascular invasion zone (level 0–70 µm below the vascular invasion line) with erythrocytes from the torn capillaries (arrows). No osteoblasts are present on the intercolumnar septa surface. Scale bar: 50 µm. (B) (SEI) Fractured surface (level about 400–500 µm below the vascular invasion line) showing sheet of osteoblasts spreading on the surface of the calcified cartilage septa beginning to form the bone matrix layer of the primary metaphyseal trabeculae. Scale bar: 20 µm.