
Figure 8.
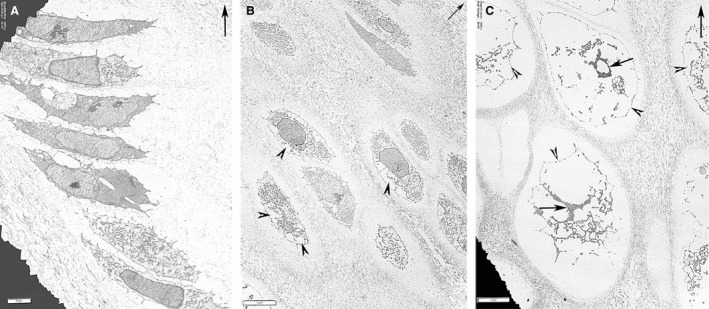
Ultra‐thin cross‐sections contrasted with uranyl‐acetate and lead‐citrate using TEM: fields of the growth plate cartilage above the vascular invasion line (top right arrow = longitudinal tibial axis). (A) (TEM) Growth plate cartilage and seriate chondrocyte cell layer show no evidence of nuclear or cytoplasmic apoptosis. Scale bar: 2 µm. (B) (TEM) Growth plate cartilage with chondrocyte volume increase and first signs of cytoplasmic lacunae (arrowheads). No changes to the nuclear chromatin. Scale bar: 5 µm. (C) (TEM) Hypertrophic chondrocytes with very large empty lacunae inside the cytoplasm; the cellular membrane is still continuous (arrowhead). The nuclear chromatin is fragmented and condensed (arrows), no nuclear membrane is recognizable. Scale bar: 5 µm.