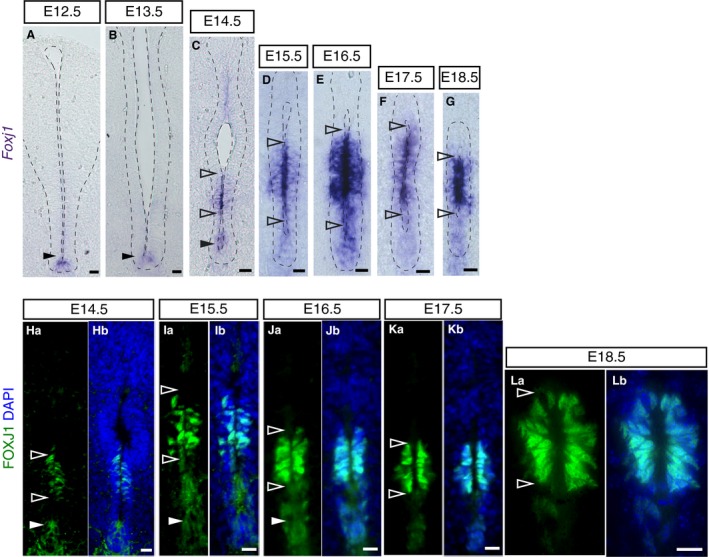
Figure 5.

Foxj1 mRNA and protein expression during mouse spinal cord development. (A–G) In situ hybridisation showing the dynamic expression of Foxj1 mRNA at the indicated stages (E12.5: 22 sections, n = 5 embryos; E13.5: 32 sections, n = 7 embryos; E14.5: 32 sections, n = 7 embryos; E15.5: 33 sections, n = 12 embryos; E16.5: 86 sections, n = 15 embryos; E17.5: 114 sections, n = 18 embryos; E18.5: 94 sections, n = 11 embryos). Note apical localisation of transcripts. Nuclei are stained with DAPI (blue). (Ha–Lb) Immunofluorescence showing dynamic expression of the FOXJ1 protein (green) at indicated stages (E14.5: 66 sections, n = 4 embryos; E15.5: 33 sections, n = 3 embryos; we also confirm findings of Li et al. 2018 at later stages E16.5: 12 sections, n = 1 embryo; E17.5: 12 sections, n = 1 embryo; E18.5: 12 sections, n = 1 embryo). Nuclei are stained with DAPI (blue). Note that low levels/gaps in expression are found in the ventricular layer between the region closer to the dorsal lumen and the domain adjacent to the floor plate at E14.5 (arrowheads in C and Ha). Scale bars: (A,B) 40 μm, (C–Lb) 20 μm.
