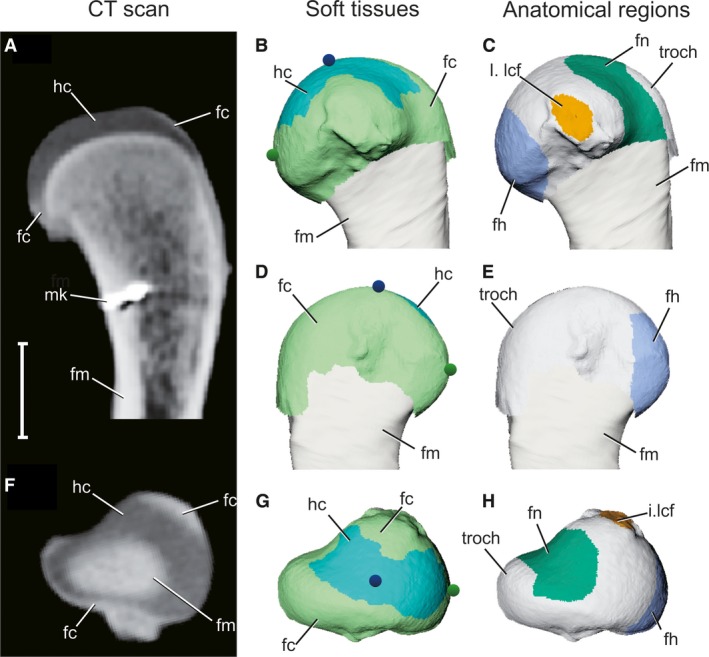
Figure 2.

Articular surface models of femoral soft tissues as reconstructed by contrast‐enhanced CT scans. (A,F) Longitudinal and axial CT sections of a right proximal femur, respectively, after 2 weeks in 5% PMA. (B,D,G) 3D model of the proximal femur in medial, lateral, and proximal views, respectively, color‐coded by soft tissue. Blue and green spheres represent the particle emitters, traced in Fig. 4. (C,E,H) 3D model of the proximal femur in medial, lateral, and proximal views, respectively, color‐coded by anatomical region. Gray signifies unassigned parts of the articular surface. Scale bar: 10 mm. fc, fibrocartilage (light green); fh, femoral head (blue); fm, femur (tan); fn, femoral neck (dark green); hc, hyaline cartilage (cyan); I.lcf, insertion of ligamentum capitis femoris (orange); mk, bone marker; troch, greater trochanter.
