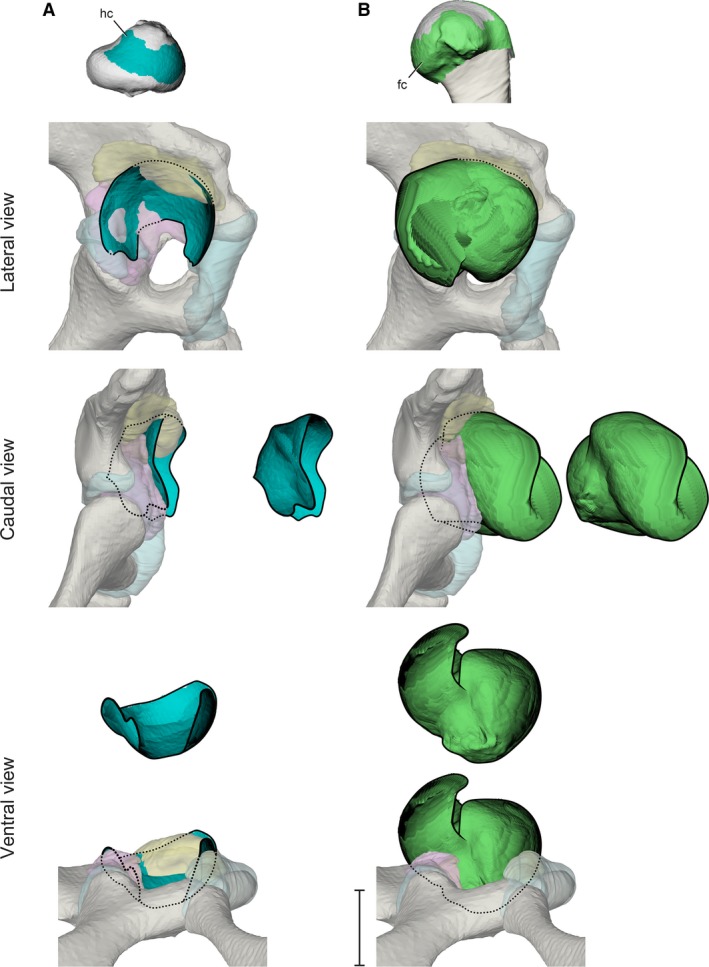
Figure 5.

Stroboscopic patch traces of the 3D positions and orientations assumed by femoral cartilaginous surfaces (top) relative to the acetabulum during a typical high‐walking stride. (A) Hyaline cartilage in lateral, caudal, and ventral views. (B) Fibrocartilage in lateral, caudal, and ventral views. Paths are shown both in acetabular context and offset for visibility. Scale bar for acetabular views: 1 cm.
