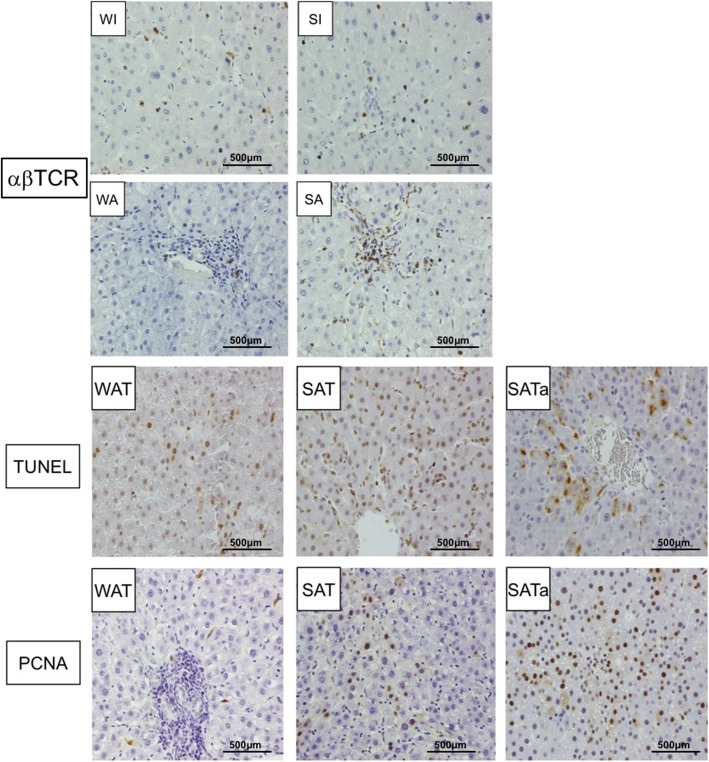
Fig. 3.
αβTCR staining and proliferation and apoptosis detection. αβTCR were the main population of infiltrating cells in SFS allografts at four days after operation. The ratio of αβTCR cells was higher in SFS allograft than in whole size allograft. SAT and SATa groups showed increased hepatocyte proliferation and apoptosis compared with WAT group 4 days after operation, which characterized by higher PCNA expression and more positive cell by TUNEL (P < 0.01). Immunohistochemical staining magnification × 120, whole size allografrs+Tac (WAT), small-for-size allograft+Tac (SAT), small-for-size allograft+Tac altered dose (SATa). Whole size isograft (WI), small-for-size isograft (SI), whole size allograft (WA), small-for-size allograft (SA)

