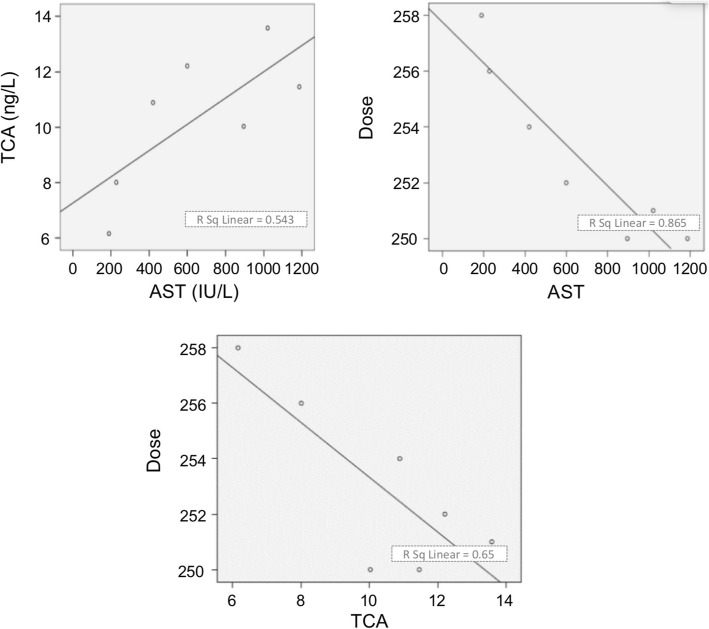
Fig. 7.
Correlation analysis. A significant correlation was found between RCA, RPA and AST (RCA and RPA R = 0.976 P = 0.001; RPA and AST R = − 0.962 P = 0.001; RCA and AST R = -0.906 P = 0.005). The tacrolimus blood concentration was decreased as AST (R = 0.758 P = 0.046). Logistical regression analysis shows regression equation: TC = 0.005AST + 7.223, TD = − 0.007AST + 257.757, TD = − 0.988TC + 263.219; TD = − 0.494TC-0.0035AST + 260.487. RPA (Ratio of proliferation to apoptosis), AST (asparatate aminotransferase), Tc (tacrolimus concentration), TD (tacrolimus dose)

