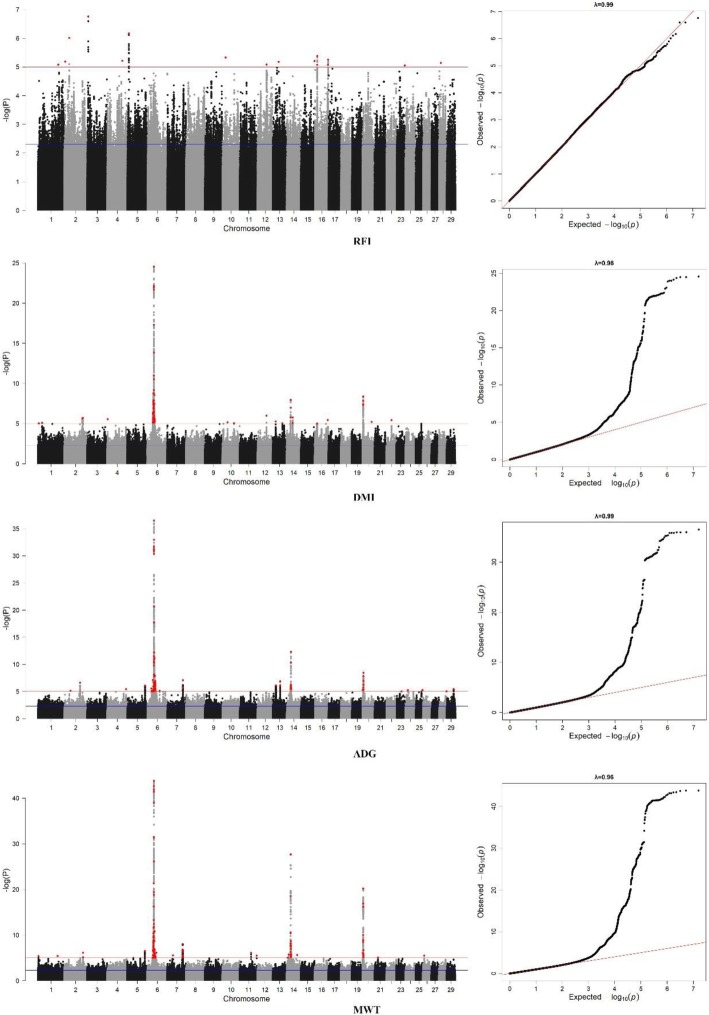
Fig. 1.
Manhattan (left) and Q-Q (right) plots of GWAS results based on the imputed 7.8 M DNA variant panel for residual feed intake (RFI) and its component traits daily dry matter intake (DMI), average daily gain (ADG), and metabolic body weight (MWT). The blue line indicates a threshold of P-value < 0.005 while the red line shows the threshold of P-value < 1.00E-05. The red dot is lead SNPs with the threshold of P-value < 1.00E-05

