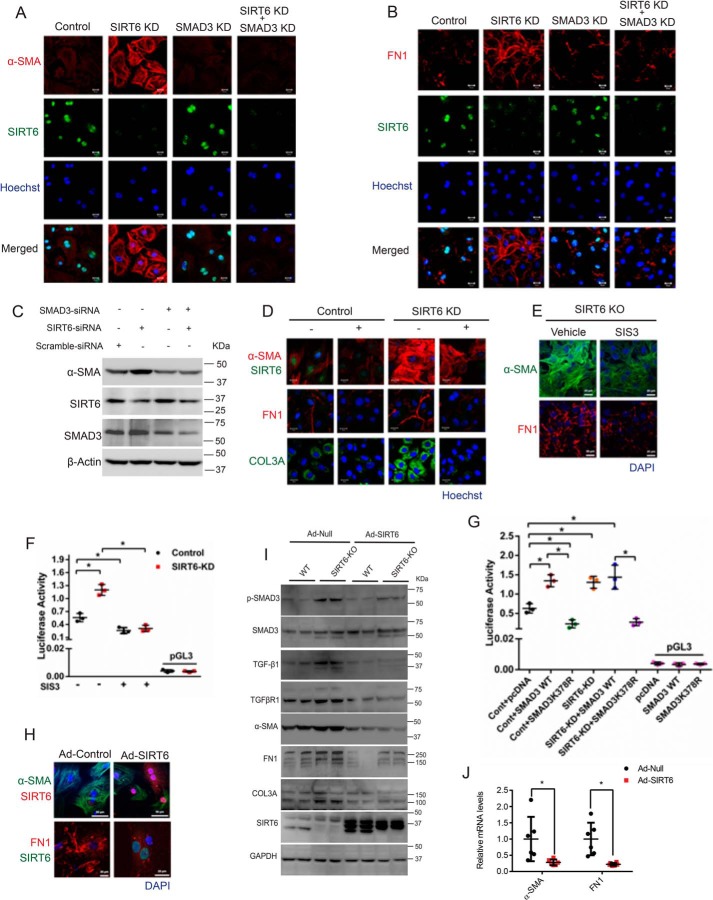
Figure 7.
A and B, representative confocal images of control, SIRT6-depleted (SIRT6-KD), SMAD3-depleted (SMAD3-KD), or both SIRT6- and SMAD3-depleted (SIRT6-KD + SMAD3-KD) cardiac fibroblasts for α-SMA and FN1. Scale bar, 20 μm. n = 3. C, Western blot analysis of control, SIRT6-KD, SMAD3-KD, or SIRT6-KD + SMAD3-KD cardiac fibroblasts for the indicated proteins. D, representative confocal images of control or SIRT6-KD cardiac fibroblasts, with or without SB-505124 treatment (2.5 μg/ml). Scale bar, 20 μm. n = 3. E, representative confocal images of control or SIS3-treated cardiac fibroblasts isolated from SIRT6-KO mouse pups. Scale bar, 20 μm. n = 3. F and G, scatter plots showing a luciferase activity assay for SBE (SBE-Luciferase). SBE-luciferase plasmid was transfected in control and SIRT6-KD cardiac fibroblasts, with or without SIS3 treatment (F) or after transfection with either pcDNA, pcDNA-SMAD3-WT, or pcDNA-SMAD3-K378R (G). H, representative confocal images of cardiac fibroblasts infected with Ad-Null or Ad- SIRT6 for the indicated proteins. Scale bar, 50 μm (for α-SMA) or 20 μm (for FN1). n = 3. I, Western blot analysis of cardiac fibroblasts isolated from WT or SIRT6-KO littermate mouse pups, infected with Ad-Null or Ad-SIRT6 for the indicated proteins. J, scatter plot representing real-time qPCR analysis of α-SMA and FN1 from fibroblasts isolated from SIRT6-KO mice and then infected with either control or SIRT6-overexpressing adenovirus. GAPDH was used to normalize the mRNA levels. Data are presented as mean ± S.D. (error bars), n = 5; *, p < 0.05. Student's t test was used to calculate the p values.

