Figure 2.
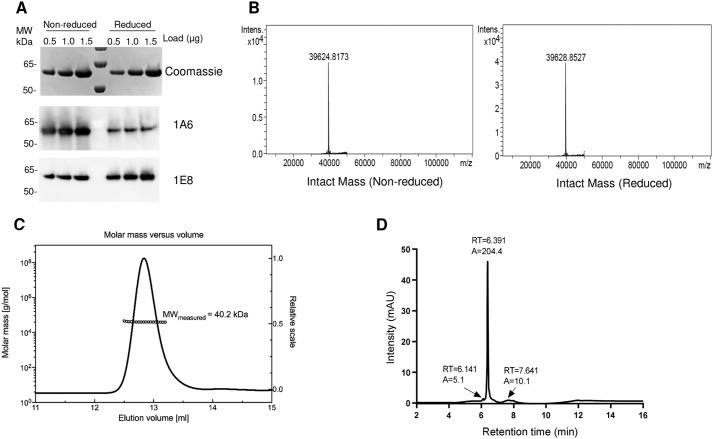
Characterization of PfCSP4/38. A, top panel, Coomassie Blue–stained 4–12.5% polyacrylamide gel with different amounts (0.5, 1.0, and 1.5 μg of PfCSP) in nonreduced and reduced conditions. Middle and bottom panels, Western blotting using the same gel loading as in the top panel with conformational (mAb 1A6, middle panel) and nonconformational (mAb 1E8, bottom panel) antibody. The sizes (kDa) of the molecular mass (MW) markers are indicated. B, deconvoluted mass spectra corresponding to the nonreduced and the reduced samples. C, SEC-MALS analysis. PfCSP4/38 was injected onto a Superdex 200 Increase 10/300 GL column, and the change in refractive index as a function of protein concentration was used to compute the molar masses. The solid line plotted on the right axis corresponds to the chromatogram of the change in refractive index from the SEC column. The right axis scale is normalized to the greatest magnitude across the chromatogram data, i.e. to the monomer peak of PfCSP4/38. The molar masses across the eluting peak are plotted as open circles (for clarity, only every tenth measurement) on the left axis (molar mass). The average molecular mass is indicated. D, reversed-phase HPLC-UV chromatograms recorded following analysis of purified protein PfCSP. The peak at 6.391 min corresponds to monomeric PfCSP4/38 antigen. In HPLC chromatograms (D), A denotes integrated peak area, and RT indicates retention time.

