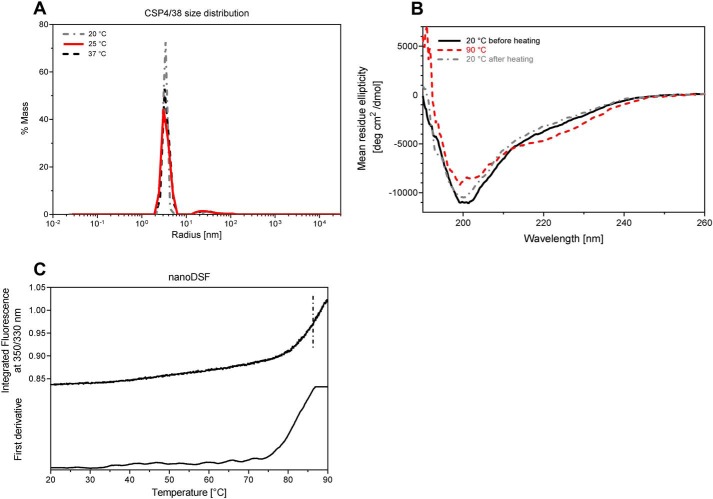
Figure 3.
Biophysical studies of PfCSP4/38. A, distributions of hydrodynamic radii obtained from DLS on PfCSP4/38 at three different temperatures. B, CD spectra of PfCSP4/38 measured at two different temperatures: 20 and 90 °C (red dashed line). CD spectra were recorded at 20 °C before (dark solid line) and after (gray dashed line) heating the protein sample at 90 °C. Mean residue ellipticity (deg cm2 dmol−1) is plotted as a function of the wavelength (nm). C, differential scanning fluorimetry (nano-DSF) spectra of PfCSP4/38. Fluorescence intensities at single wavelengths of 350 nm (F350) and 330 nm (F330) were recorded. The F350/F330 ratio (upper panel) and its first derivative (lower panel) are plotted as functions-of the temperature.

