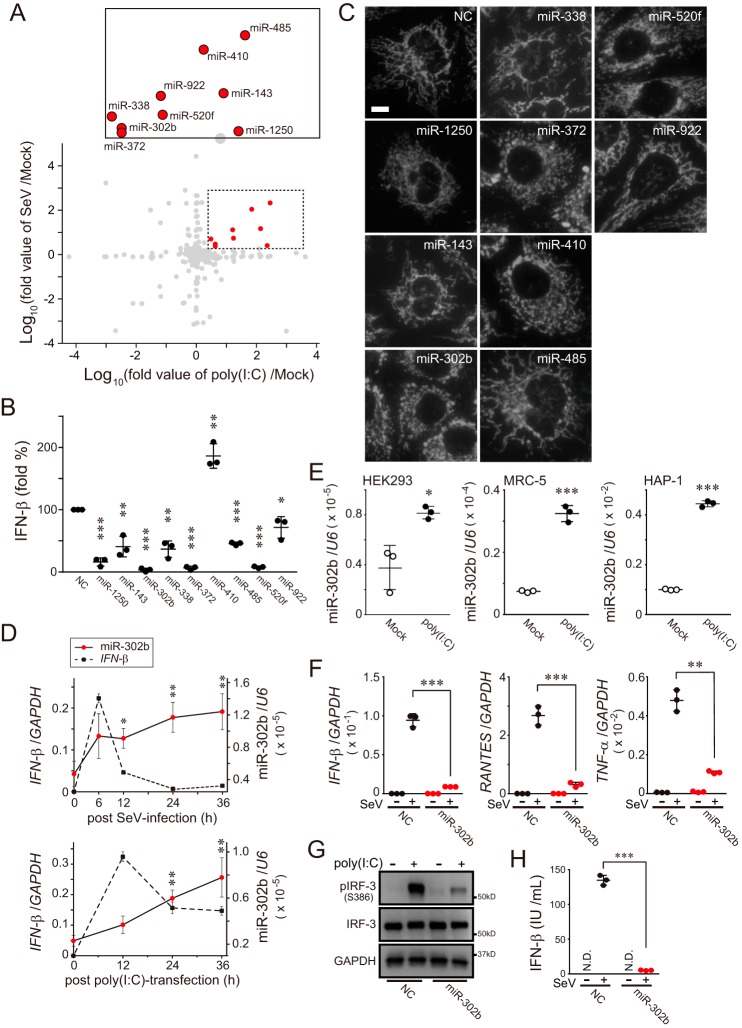
Figure 1.
MicroRNAs that respond to RLR-mediated antiviral signaling. A, log–log plot showing fold-change in miRNA expression (analyzed by TaqMan low-density array) in HEK293 cells transfected with poly(I-C) (10 μg for 24 h) versus Mock-transfected cells plotted against those of SeV infection (16 hemagglutinin units (HAU)/ml for 24 h) (n = 1). The dashed box in the graph shows the significantly increased miRNA area (abundance ratio >2), and the inset on the top shows the annotated miRNAs from the dashed box. B, activation of the IFN-β reporter (p125luc) in miRNA mimic-treated HEK293 cells (each, 10 nm concentration) transfected with 500 ng of poly(I-C) for 24 h. NC (left in the graph) means negative control mimic. Data shown represent mean values ± S.D. (n = 3). *, p < 0.05; **, p < 0.01, and ***, p < 0.001. C, indicated nine miRNA mimics were transfected in HeLa cells, and mitochondria in the cells were identified by stable expression of mitochondrially-targeted red fluorescent protein (12) by fluorescence microscopy. Scale bar, 10 μm. NC, negative control mimic. D, kinetics of IFN-β and miR-302b expression in A549 cells with either SeV infection (top) or poly(I-C) transfection (bottom). The stimulated cells were collected at the indicated time points (0, 6, 12, 24, and 36 h) and analyzed by qPCR. Both GAPDH and U6 were used as internal controls. Data shown represent mean values ± S.D. (n = 3). *, p < 0.05, and **, p < 0.01. E, expression profiles of miR-302b detected by qPCR in three cell lines (HEK293, MRC-5, and HAP-1) post-transfection with 5 μg of poly(I-C) 24 h later. U6 was used as an internal control. Data shown represent mean values ± S.D. (n = 3). *, p < 0.05; ***, p < 0.001. F, negative control or miR-302b mimic-transfected HEK293 cells were infected with SeV (4 HAU/ml) for 24 h, and the total RNAs from the cells were analyzed by qPCR for the expression of IFN-β, RANTES, TNFα, and GAPDH (internal control). Data shown represent mean values ± S.D. (n = 3). **, p < 0.01 and ***, p < 0.001. G, similar to F, except that the cells were stimulated with 2 μg of poly(I-C), and endogenous IRF-3 activation (phosphorylation) was detected by Western blotting. H, similar to F, except that the culture supernatants from cells were analyzed by ELISA to measure IFN-β production. N.D., not detected. Data shown represent mean values ± S.D. (n = 3). ***, p < 0.001.

