Figure 3.
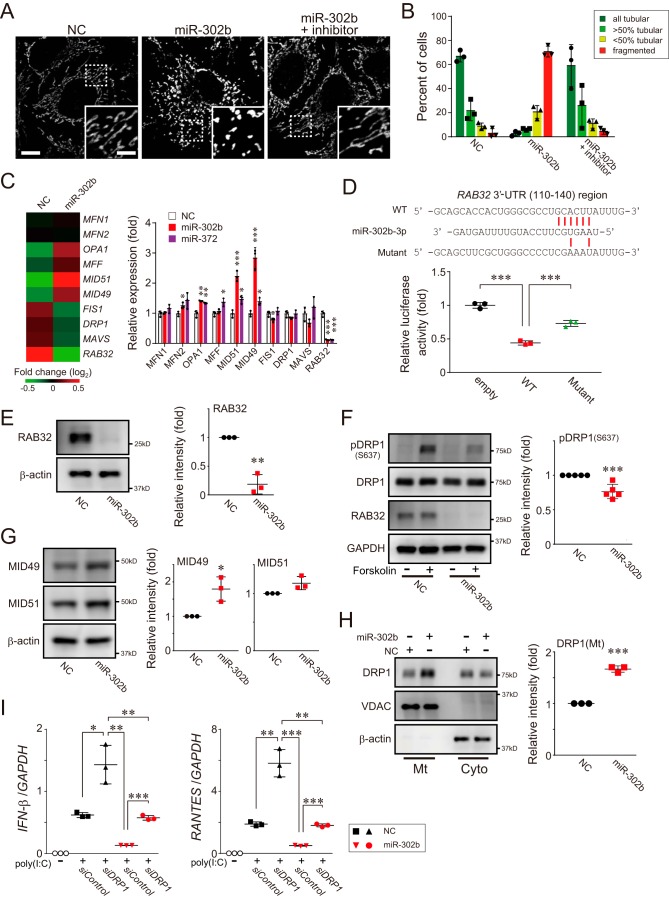
miR-302b promotes mitochondrial fission through a DRP1-dependent pathway. A, HeLa cells were transfected with either negative control (NC) or miR-302b mimics, and the mitochondrial morphology of the transfected cells was monitored 72 h later by immunofluorescence microscopy. Mitochondria in the cells were stained with an antibody against mtHSP70. The presence of an miR-302b–specific inhibitor rescued its defects in mitochondrial tubular networks (right, miR-302b + inhibitor). Each inset depicts a magnified image of the dashed-boxed area. Scale bar, 10 μm (inset, 5 μm). B, quantification of mitochondrial morphology in A. Cells were scored as one of four morphologic categories as depicted in the inset, and at least 200 cells were scored. Data shown represent mean values ± S.D. (n = 3). C, total RNAs were isolated from HEK293 cells post-transfection with either negative control (NC) or miR-302b mimics for 72 h, and microarray analysis was performed (n = 1). The heat map (left) compared the expression profile of mitochondrial dynamics–related genes and was generated by MeV software (45). The color indicates the distance from the median of each row. The right graph shows the gene expression profiles of the cells transfected either with miR-302b or miR-372 mimics for 72 h and analyzed by qPCR. NC, negative control mimic. The qPCR data shown represent mean values ± S.D. (n = 3). *, p < 0.05; **, p < 0.01; and ***, p < 0.001. D, HEK293 cells were transfected with either plasmid, psiCHECK-2 (empty), or psiCHECK-2 that cloned a 3′-UTR region of RAB32(110–140), together with an miR-302b mimic. The transfected cells were analyzed 24 h later for reporter gene-dependent luciferase activity. Top, predicted base-pairing between miR-302b-3p and the RAB32 target, and the positions of paired sites are indicated by the red bars. Data shown represent mean values ± S.D. (n = 3). ***, p < 0.001. E, HEK293 cells were transfected with the negative control or miRNA mimics, and the whole-cell lysates were analyzed by Western blotting with an antibody against RAB32 (left). The band intensity of RAB32 was measured with QuantiStudio and normalized to the intensity of β-actin (right) (data shown represent mean values ± S.D. (n = 3)). **, p < 0.01. F, HeLa cells were transfected with the negative control or miRNA mimics and 72 h after transfection, DRP1 phosphorylation (Ser637) levels of forskolin-stimulated cells were analyzed 72 h later by Western blotting (left). The band intensity of pDRP1 (S637) was measured and normalized to the intensity of GAPDH (right) (data shown represent mean values ± S.D. (n = 5)). ***, p < 0.001. G, similar to E, except that the expression levels of MID49 and MID51 were analyzed by Western blotting. Data shown represent mean values ± S.D. (n = 3). *, p < 0.05. H, similar to E, except that the endogenous DRP1 localization in cytosolic (Cyto) and mitochondrial (Mt) fractions isolated from the cells was analyzed by Western blotting. Data shown represent mean values ± S.D. (n = 3). ***, p < 0.001. I, HEK293 cells were transfected with either the negative control or miRNA mimics, together with the DRP1 siRNA (versus siControl) for 48 h. The transfected cells were then stimulated with poly(I-C) delivery into cells, and the expression of IFN-β, RANTES, and GAPDH (internal control) was measured by qPCR post poly(I-C) transfection (2 μg). Data shown represent mean values ± S.D. (n = 3). *, p < 0.05; **, p < 0.01; and ***, p < 0.001.

