
Figure 6.
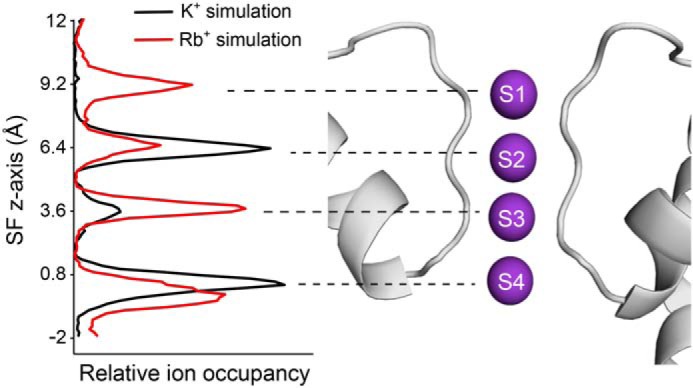
MD simulation reveals differential occupancy of SF by K+versus Rb+. Double-bilayer simulations of TWIK-1 with either K+ or Rb+ reveal a different occupancy of the S1–S4 ion-binding sites. The relative ion occupancy for outward currents is shown plotted against the position of the SF on the z axis (K+ in black and Rb+ in red). The data shown were collected from multiple repeats that each represent a total of 6-μs simulation during which seven outward permeation events were observed for K+ and 13 events for Rb+. The peaks shown on the left correspond to the S1–S4 ion-binding sites. These are structurally aligned with a depiction of the selectivity filter and pore helices of TWIK-1.