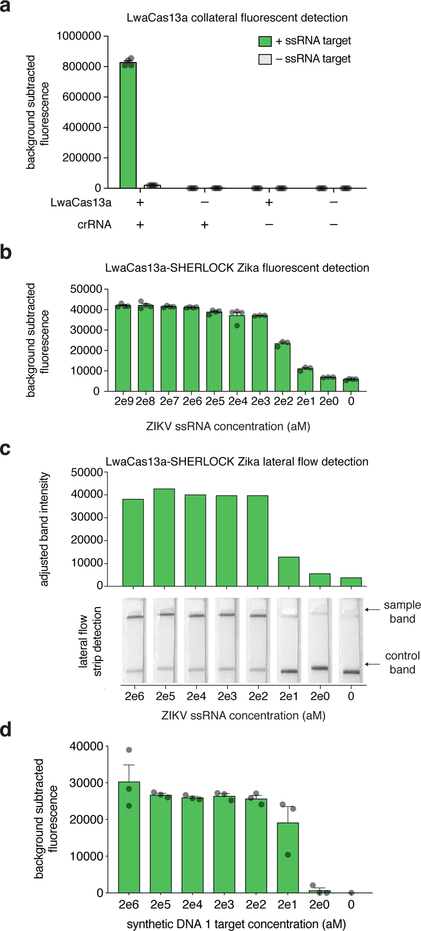
Figure 5: Anticipated fluorescence and lateral flow results.
(a) LwaCas13 detection of ssRNA 1 is dependent on the formation of a protein-crRNA-target complex. Reactions contain LwaCas13a and crRNA, LwaCas13 or crRNA alone, or neither protein nor crRNA, in the presence or absence of a single ssRNA 1 target. Bar graphs indicate mean ± SEM of background-subtracted fluorescence measured from four technical replicates; each individual replicate is represented as a dot.
(b) Fluorescence detection for a synthetic RNA version of Zika virus with decreasing input concentrations with a two-step SHERLOCK reaction. Each bar represents the detected collateral cleavage activity for a given input concentration. Bar graphs indicate mean ± SEM of background-subtracted fluorescence measured from either three or four technical replicates; each individual replicate is represented as a dot.
(c) Lateral flow detection for a synthetic RNA version of Zika virus with decreasing input concentrations with a two-step SHERLOCK reaction. Samples were detected with a 30 minute RT-RPA incubation followed by a 1 hour LwaCas13 reaction prior to lateral flow strip detection. Adjusted band intensities (determined from lateral flow strips) are shown, as well as individual lateral flow strips, with positive and control sample lines indicated with arrows16.
(d) Fluorescence detection of synthetic DNA 1 target with decreasing input concentrations using a one-pot SHERLOCK reaction combining the RPA, T7, and LwaCas13 detection steps. Bar graphs indicate mean ± SEM of background-subtracted fluorescence measured from either three technical replicates; each individual replicate is represented as a dot14.

