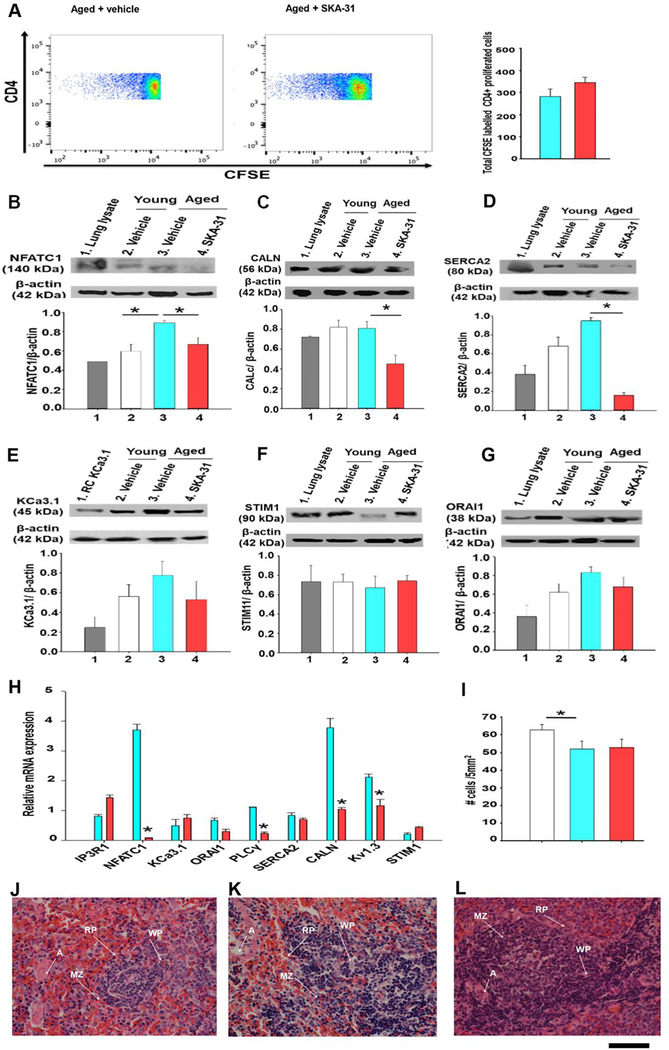
Figure 5 -. SKA-31 administration regulates the expression of calcineurin/NFAT signaling components in T cells.
Panel A displays representative FACS analysis of splenic lymphocytes (1×10⁶ cells) isolated from vehicle and SKA-31 treated aged rats, which were first labeled with CFSE, stimulated with phytohemagglutinin A and cultured for ~5 days at 37°C. Cells were then labeled with anti-CD4 BV510 to enable discrimination between other splenic cells. Events (~200,000) were identified based on the fluorescence intensity above the background auto-fluorescence level, ensuring that only CFSE-positive events were analyzed. The selected fluorescence intensities reflect gating of the proliferative T cell population in each treatment group. Blue represents the lowest fluorescence intensity; red represents the highest. The accompanying histogram depicts cell division in the T cell compartment, as revealed by anti-CD4+ staining. Blue = vehicle treated aged rats, red = SKA-31 treated animals. Panels B-G present western blot analysis and quantification of NFATC1 (B), calcineurin catalytic subunit (C), SERCA2 ATPase (D), KCa3.1 channel (E), STIM1 (F) and ORAI1 channel (G) in splenic CD4+ T cells from vehicle treated young (white), vehicle treated aged (blue) and SKA-31-treated aged rats (red). For each primary antibody tested, a lysate derived from a tissue or recombinant cell (RC) expressing the target protein was included as a positive control, and is displayed in lane 1 of each blot. Staining intensities of the various immuno-reactive bands detected in T cell homogenates are expressed as a function of β-actin (n = 4 animals/group). An asterisk signifies a statistically significant difference between the two indicated groups, as determined by one-way ANOVA and a Tukey’s post-hoc test (P < 0.05). Note that full length, uncropped images of the blots displayed in this figure are presented in Supplementary Figure 11. Panel H displays the mRNA expression of key signaling proteins in splenic CD4+ T cells from vehicle (blue) and SKA-31 treated (red) aged rats. The qPCR results for each target have been normalized to the mRNA expression of the same gene observed in vehicle treated young animals; GAPDH was utilized as the internal reference gene for all qPCR analyses. Relative mRNA expression was calculated using REST software. An asterisk indicates a statistical difference compared with the vehicle treated aged rats, as determined by an unpaired Student’s t-test (P<0.05) (n=3–5 animals/group). Panel I displays the quantification of cells per 5mm2 of H&E stained sections of intact spleen from vehicle treated young animals (white bars), vehicle (blue bars) and SKA-31 treated aged rats (red bars), as determined by ImageJ software (n=6 animals/group). Panels J-L show H&E staining of spleen sections (400x magnification) from vehicle treated young animals (J), vehicle (K) and SKA-31 treated (L) aged rats. The scale bar beneath the bottom right corner of panel L represents 50 microns and applies to all three images; RP: Red Pulp, WP: White Pulp, MZ: Marginal Zone, A: Artery.

