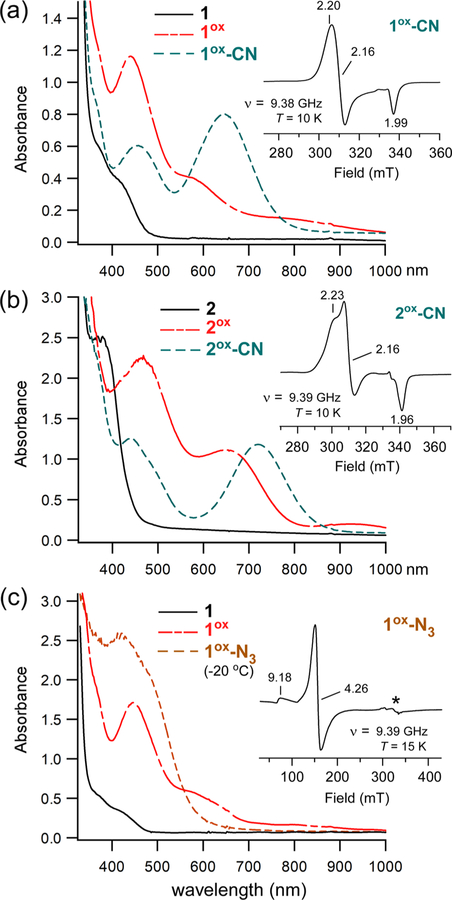
Figure 3.
UV–vis and EPR spectra of oxidized derivatives of complexes 1 and 2. Absorption spectra were measured in CH2Cl2 at either −78 °C (a) or −70 °C (b, c), with the exception of the 1ox-N3 spectrum (20 °C). Samples of 1ox and 2ox were generated by treatment of 1 and 2, respectively, with 1 equiv of [AcFc]BF4. Further addition of 50 equiv of (a) [NBu4]CN, (b) [NEt4]CN, or (c) [NBu4]N3 gave rise to the cyano and azido adducts (formation of the latter required warming to 20 °C). Initial concentration of Fe complex: (a) 0.52 mM, (b) 0.59 mM, and (c) 0.45 mM. Insets: X-band EPR spectra of (a) 1ox-CN, (b) 2ox-CN, and (c) 1ox-N3 measured in frozen CH2Cl2 solutions at the indicated temperature. The microwave power was 2 mW, and the frequency (ν) is indicated. The features designated by an asterisk (*) arise from a copper impurity in the sample cavity.

