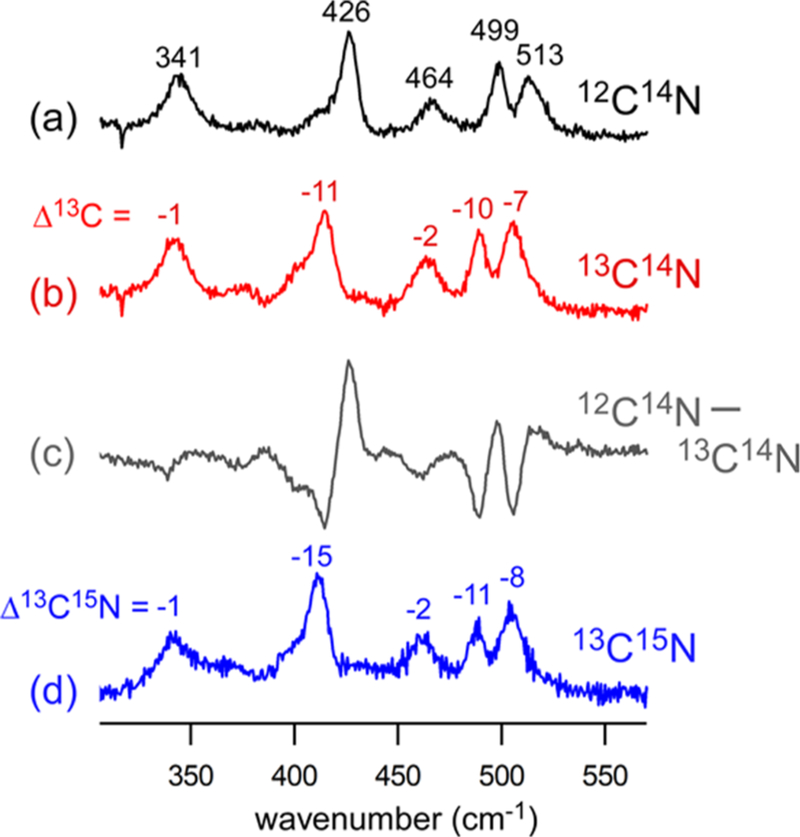
Figure 4.
Resonance Raman spectra of 1ox-CN collected using 647.1 nm laser excitation (~40 mW at the sample). The samples were prepared by treating 1ox with (a) natural abundance KCN (50 equiv) in CD2Cl2, (b) K13CN (50 equiv) in CD2Cl2, and (d) K13C15N (10 equiv) in CH2Cl2. The KCN salts were solubilized using 18-crown-6 ether. The difference spectrum (a–b) generated by digital subtraction is provided in (c). The 13C and 13C15N isotope shifts relative to the NA spectrum are indicated in cm−1.

