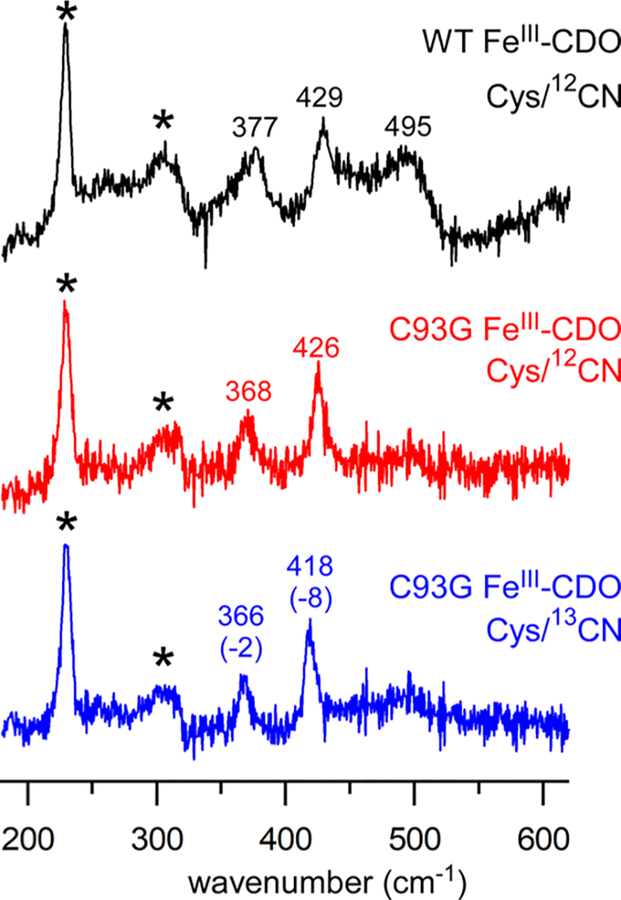
Figure 6.
Resonance Raman spectra of Cys/CN adducts of CDO collected at 77 K using 647.1 nm laser excitation (20–25 mW at the sample): (upper spectrum) WT FeIII-CDO treated with Cys and natural abundance KCN; (middle spectrum) C93G FeIII-CDO treated with Cys and natural-abundance KCN; (lower spectrum) C93G FeIII-CDO treated with Cys and K13C14N. Peaks labeled with an asterisk arise from the lattice modes of ice. Frequencies and 13C isotope shifts (in cm−1) are provided for select peaks.

