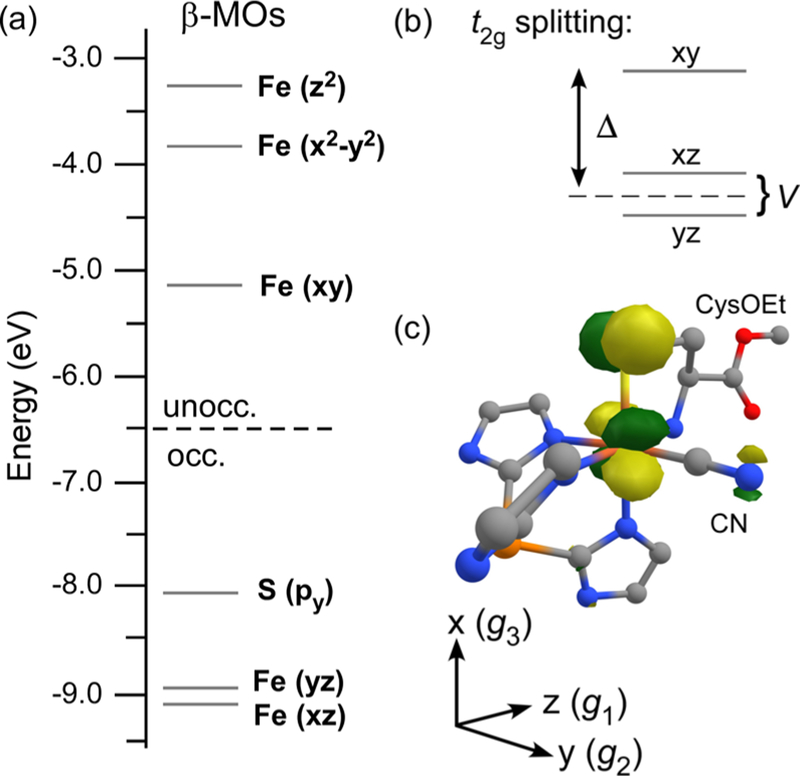
Figure 8.
(a) MO diagram derived from a spin-unrestricted DFT calculation (TZVP/B3LYP) of 1ox-CN. MOs are labeled according to their principal contributor, and energies correspond to the spin-down (β) orbitals. (b) Schematic depiction of Δ and V splittings of the t2g set of Fe 3d orbitals. (c) DFT-generated isosurface plot of the singly occupied natural MO of 1ox-CN (phenyl rings of TIP ligand omitted for clarity).

