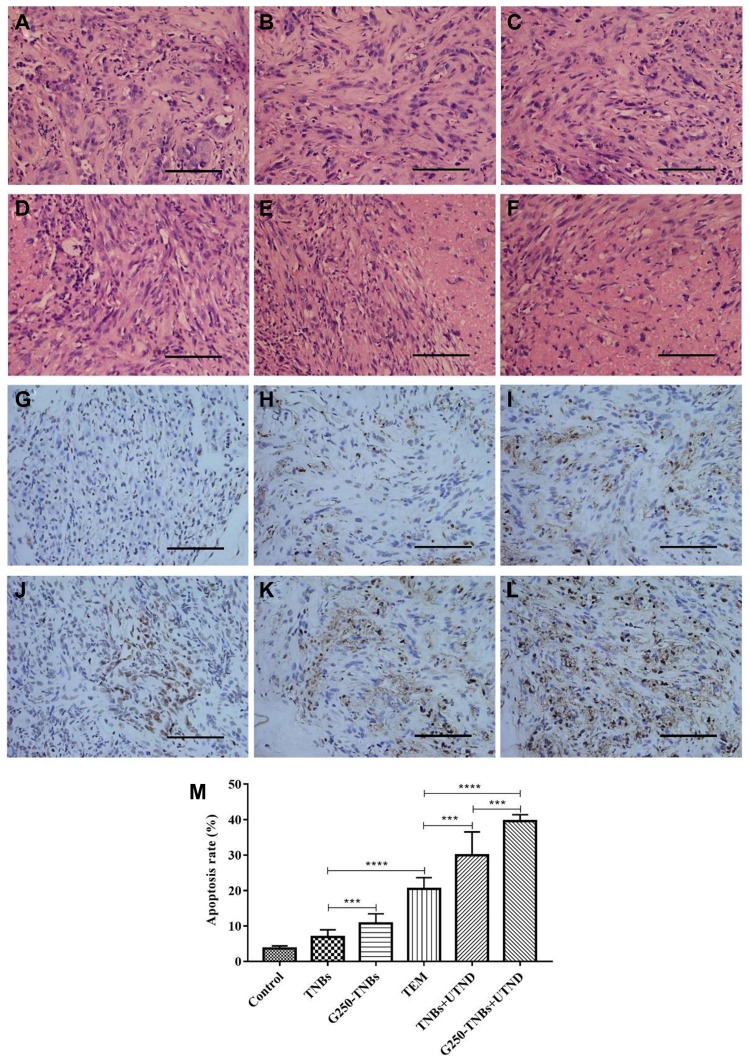
Figure 7.
Immunohistochemical analysis of the xenograft tumor tissue. (A–F) H&E staining results of the control group, TNB group, G250-TNBs group, TEM group, TNBs+UTND group, and G250-TNBs+UTND group, respectively. (G–L) TUNEL staining results of the control group, TNB group, G250-TNBs group, TEM group, TNBs+UTND group, and G250-TNBs+UTND group, respectively. Scale: 100 μm; (M) the apoptosis index for each group of tumor tissues (***P<0.001, ****P<0.0001).

