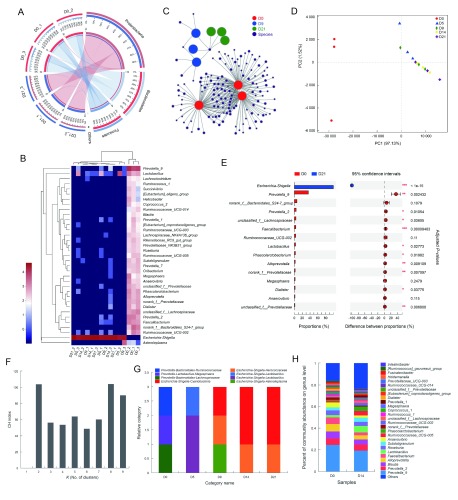
2. Changes in commensal bacteria spectrum in stool after antibiotic treatment.
A: Relationship between samples and bacterial community at phylum level. Data were rendered by Circos (Krzywinski et al., 2009). Left half-circle represents composition of species in sample, color of outer ribbon represents which group it comes from, and colors of inner ribbon represent phyla. Right half-circle represents distribution proportion of each phylum in samples from different days, outer ribbons represent phyla, inner ribbon color represents different groups. Length of bars from each phylum indicates relative abundance of that phylum in corresponding sample. B: Abundances of top 35 genera in each sample were selected and compared with abundances of these genera in other samples by heatmap. C: Network analysis elucidating distribution of samples and species (abundance>50) at OTU level, highlighting similarities and differences between samples. D: PCA plot displaying variation in community structure during treatment at OTU level. Each point represents an individual. E: Bar plot showing significantly different phylotypes between pre- and post-ABX-treated rhesus monkeys at genus level. Statistical analysis was performed by Student’s t-test and P-values were adjusted by FDR. n=3, in each group. *: P<0.05, **: P<0.01, ***: P<0.001. F, G: Enterotype analysis. Clustering analysis using Jensen-Shannon distance (JSD) and partitioning around medoids (PAM) method. Calinski-Harabasz (CH) index was then used to calculate optimal clustering K value (K=8), and bar plot was used for visualization of each sample’s enterotype. H: Bar plot displaying variation in community structure of monkey receiving sucrose-treatment only at genus level.

