Figure 7.

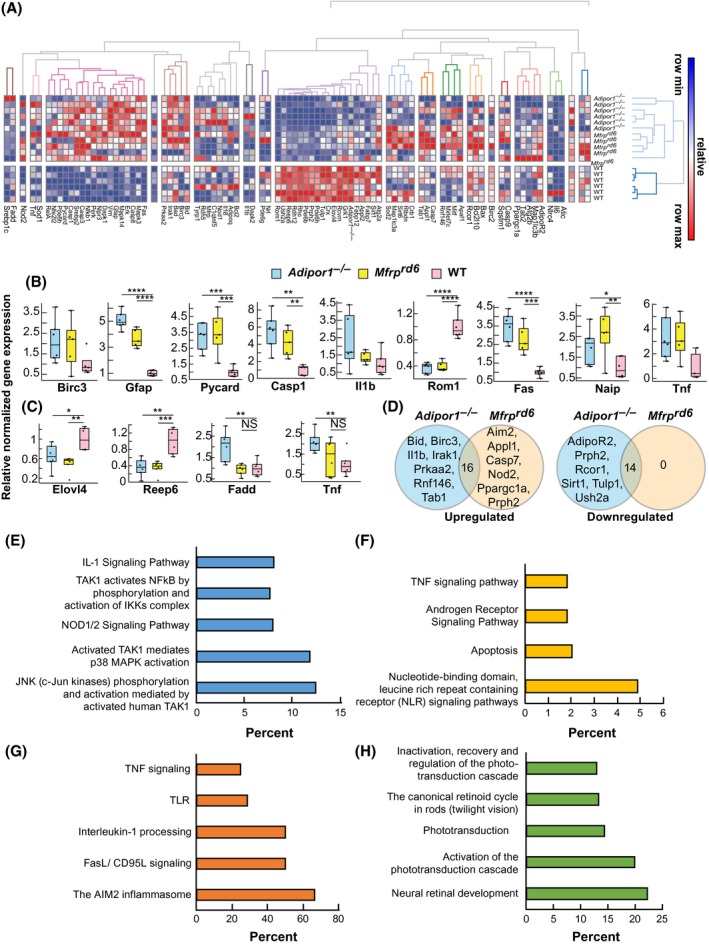
The expression of inflammatory markers is increased and visual system markers decreased in Adipor1−/− and Mfrprd6. A, Heat map illustrating the hierarchical clustering of 88 target genes for the retinas of Adipor1−/− (n = 6), Mfrprd6 (n = 5) and WT mice (n = 6). Color key represents row scaling of normalized fold‐change (FC) expression values from RT‐qPCR. B, Box‐plots representation of selected genes for the retinas with their FC below − 2 or above + 2, relative to the WT. Boxes denote median values with upper and lower quartiles, and whiskers, minimum and maximum outliers. C, Box‐plots representation of selected genes for the RPE‐eyecup samples with their FC below − 2 or above + 2, relative to WT. D, Venn diagrams of differentially expressed genes within Adipor1−/− and Mfrprd6 datasets that are upregulated or downregulated in a statistically significant manner in the retina compared to the WT. The number in the intersection represents the differentially expressed genes that are common between the two datasets (Supplemental Table 1). Top pathways resulting from the upregulation of genes in Adipor1−/− retina (E) or Mfrprd6 retina (F) compared to the WT, or common upregulated (G) or downregulated (H) genes in both mutant retinas. Student's t test was used. *P ≤ .05, **P ≤ .01, ***P ≤ .001, ****P ≤ .0001, NS = not significant. Error bars represent standard deviation. When there was no statistical difference in the mutant datasets compared to the WT, statistic bars were not added
