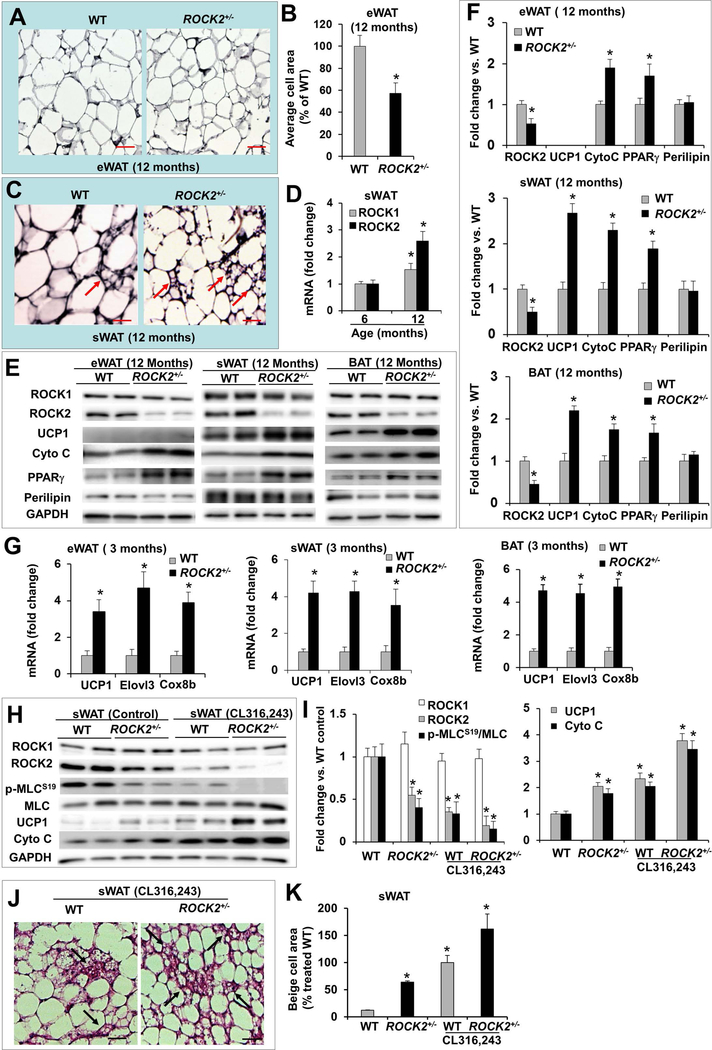
Figure 2. ROCK2+/− mice show increased expression of thermogenic genes and higher sensitivity to β-adrenergic signaling attributing to augmentable beige adipocyte formation in subcutaneous fat depots.
A. H&E staining of eWAT from male WT and ROCK2+/− mice. B. Average adipocyte areas of eWAT, >400 cells from H&E stained sections were measured for each group. *P < 0.05 vs. WT mice. C. H&E staining of sWAT (inguinal) (arrows: multilocular beige adipocytes). Bar, 50 μm. D. Relative mRNA levels of ROCK1 and ROCK2 in WT sWAT, GAPDH was used as reference gene for this and following quantitative gene expression analysis, the mean normalized value at 6 months was defined as 1.0. *P < 0.05 vs. 6 months. E-F. Representative images (E) and quantitative analysis (F) of Western blot analysis of eWAT, sWAT and BAT. The expression level of each protein was normalized with GAPDH and the mean normalized value in WT was defined as 1.0. *P < 0.05 vs. WT mice. G. Relative mRNA levels in fat depots of 3-month old mice, the mean normalized value in WT was defined as 1.0. H-I. Representative images (H) and quantitative analysis (I) of Western blot analysis of sWAT. The expression of each protein was normalized to GAPDH level and the mean normalized value in untreated WT was defined as 1.0. n = 4–6/group. *P < 0.05 vs. untreated WT mice. J. H&E staining of paraffin sections of sWAT from 3-month old mice and 10 days post IP injection of CL316,243 (1 mg/kg body weight) showing multilocular beige adipocytes (arrows). Bar, 50 μm. K. Quantitative analysis of beige cell area expressed as percent change relative to treated WT mice (n=4–6/group, 5–8 sections/sample). *P < 0.05 vs. untreated WT mice.

