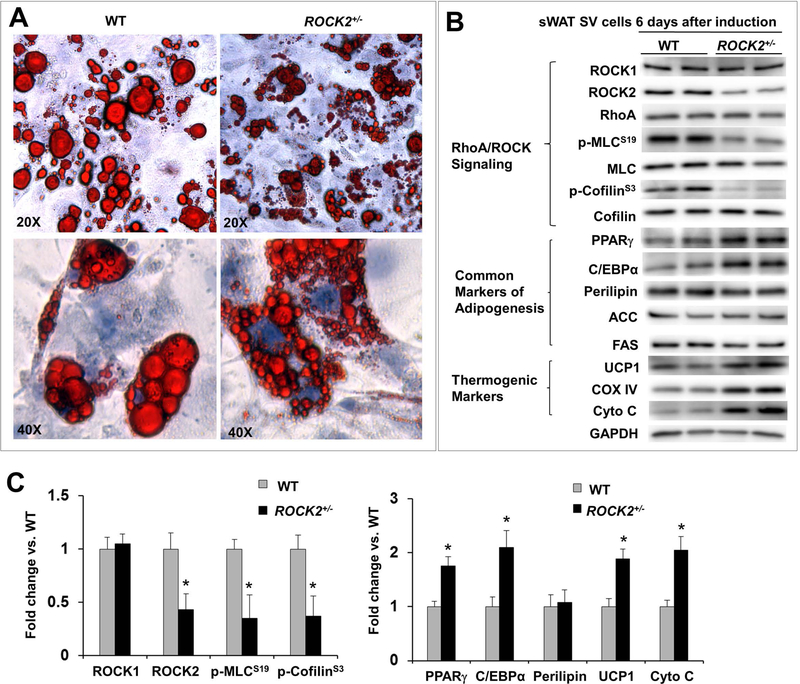
Figure 6. Partial ROCK2 deletion enhances in vitro beige adipogenesis.
A. Representative image of ORO staining lipid droplets in SV cells on post differentiation induction day 6, the cells were isolated from sWAT of WT and ROCK2+/− mice, showing smaller lipid droplet formations in ROCK2+/− cells. B-C. Representative images (B) and quantitative analysis (C) of Western blot analysis of SV cells 6 days post differentiation induction isolated from sWAT of WT and ROCK2+/− mice, showing reduced ROCK2 expression and ROCK activity, increased PPARγ and C/EBPα expression, and increased thermogenic protein expression in ROCK2+/− cells. The expression level of each protein was normalized to that of GAPDH and the mean normalized value in WT was defined as 1.0 (n = 4–6/group). *P < 0.05 vs. WT mice.

