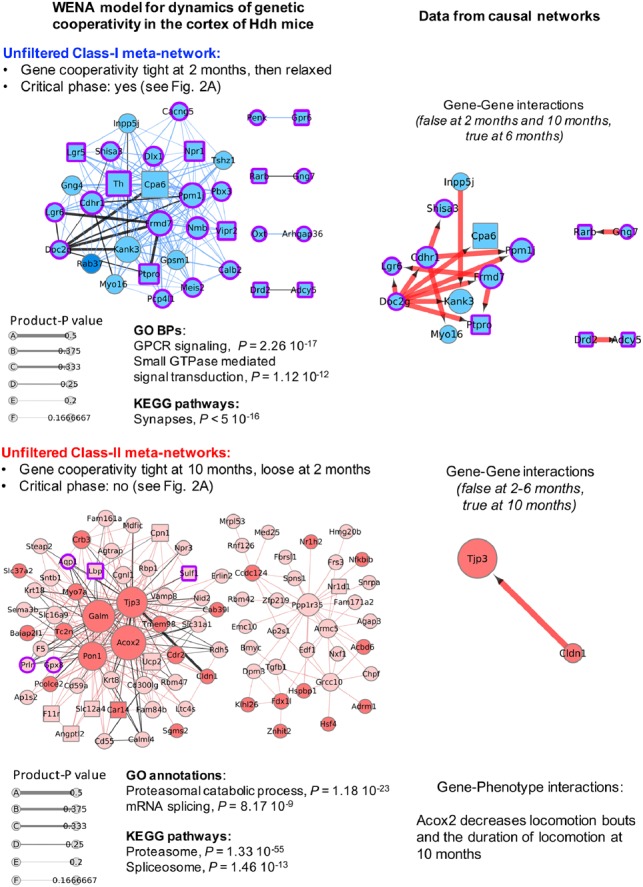
Fig. 3.

Temporal dynamics of genetic cooperativity in the cortex of Hdh mice. Shown are the unfiltered Class-I meta-network (blue nodes) containing 162 weighted edges and Class-II meta-network (red nodes) containing 271 weighted edges such that |product-P| > 0. Node size is scaled with node degree (number of neighbors). Edge thickness is scaled with product-P value. Dark (red or blue) colors indicate up-regulated genes. Light (red or blue) colors indicate down-regulated genes. Purple borders indicate genes with |LFC| > 0.5, i.e. the LFC value that distinguishes critical from non-critical phases of genetic cooperativity (see Fig. 2). Squared nodes are druggable genes. Black edges indicate that the edge is direct in at least one the source network families. Corresponding information in causal networks shows edge orientation as predicted by Bayesian causal inference with indication of the effect (blue: decrease; red: increase) of mRNA abundance of the upstream gene on that of the downstream gene. Gene-phenotype interactions are also indicated for Class-II genes, i.e. the genes associated with the most symptomatic phase of the disease process. Biological annotations (n > 10 genes, P < 1 × 10⁻⁴) are inferred from STRING analysis, using high-confidence neighbors (see Supplementary Methods for settings). In the Class-I meta-network, the direct weighted edge with the highest combined values for product-P and betweenness involves Cpa6 (also the hub gene with the highest degree: see Supplementary Table S10), a carboxypeptidase that processes several neuropeptides, and Doc2g, a double-C2 protein involved in synaptic vesicle exocytosis (Yao et al., 2011). Gene–gene interaction data in causal networks (Supplementary Table S11) indicates that Doc2g may act upstream of most of the other nodes in this meta-network, including Cpa6. Consistently with the outcome of WENA, this prediction is true for Hdh mice at 6 months of age and was not detected for mice at 10 months of age. WENA further indicates that the tightness of genetic cooperativity between Doc2g and Cpa6 is maximal at 2 months of age, then is relaxed. The same applies to the other causal gene-to-gene relationships relevant to cortex at 6 months of age. Although the Cpa6-Doc2g edge is direct as predicted by WGCNA and Bayesian network analysis, BGM network data indicate that the path linking these two genes could involve Cyp39a1 and Doc2b. In the Class-II meta-network, the direct weighted edge with the highest combined values for product-P and betweenness recruits Tjp3 (also known as Zonula occludens-3; hub gene with the third highest degree value), a tight junction protein that interacts with connexins, and claudin Cldn1, a component of tight junctions, suggesting this meta-network might also regulate the plasticity of electrical synapses (Flores et al., 2008). Gene–gene interaction data in causal networks (Supplementary Table S11) indicates that Cldn1 may act upstream of Tjp3. Consistently with the WENA model, this prediction was only detected for Hdh mice at 10 months of age. WENA further indicates that cooperativity between these two genes is loose at 2 months of age, becoming tight at 10 months of age. WENA also indicates that the path linking these two genes may involve cytochrome B reductase Cybrd1 and phospholipid phosphatase Lppr1 as provided in BGM networks (see Supplementary Table S11). Gene-phenotype interactions in causal networks (see Supplementary Table S10) indicate that acyl-CoA oxidase 2 (Acox2) may negatively influence two disease phenotypes at 10 months, including locomotion bouts and the duration of locomotion
