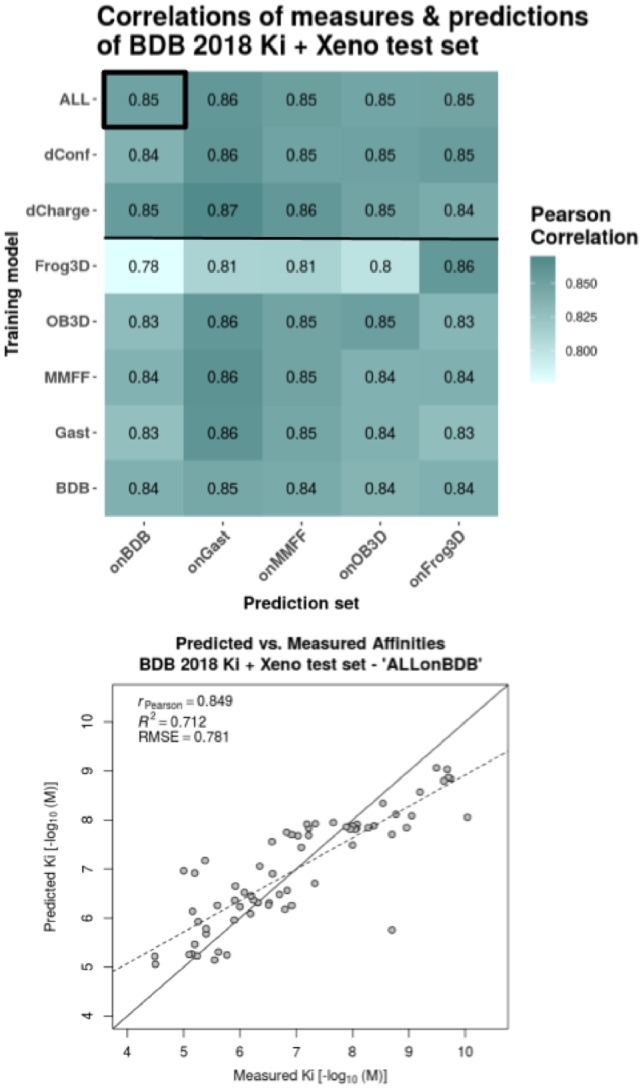
Fig. 3.

Performance evaluation of extended models on their respective 20% left-out test sets. The initial dataset of 281 ligands is extended by a set of 66 xenochemicals. The heatmap shows Pearson correlations between predictions and measures for all combinations of training model and prediction set. The different training models are listed as rows and the test sets, on which the predictions were made, are listed as columns. RF models were trained on each dataset separately (‘MMFF’, ‘Gast’, ‘BDB’, ‘OB3D’, ‘Frog3D’), on the combination of the three different 3D conformation datasets ({‘BDB’, ‘OB3D’, ‘Frog3D’} = ‘dConf’), on the combination of the three different partial charge datasets ({‘MMFF’, ‘Gast’, ‘BDB’} = ‘dCharge’) and on all five datasets combined (= ‘ALL’). The predictions with the Pearson correlation highlighted in the heatmap (black box) is plotted as scatter-plot for details below. The scatter plot shows the actual predicted versus measured affinities together with a regression line (dashed line), the optimal prediction line (solid diagonal) and the evaluation metrics—Pearson correlation coefficient (rP), coefficient of determination (R2) and root-mean-square error (RMSE). All evaluation metrics were calculated with respect to the actual values (solid diagonal), not the regression line
