
Fig. 1.
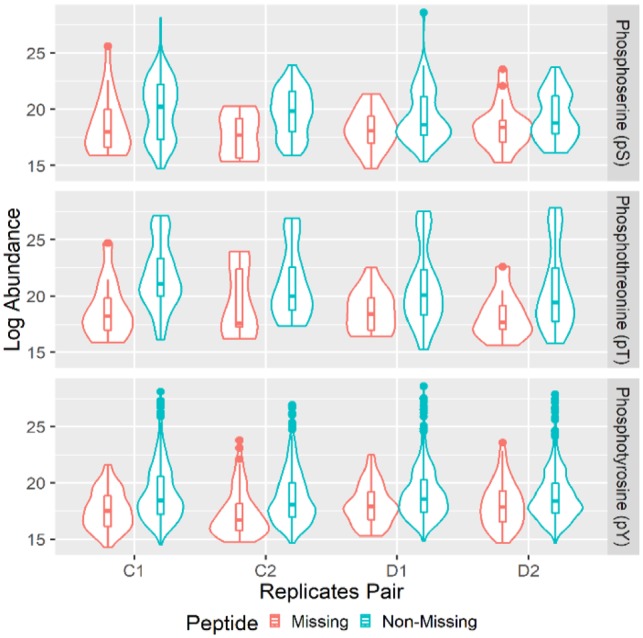
Missing pattern in MS proteomics technical replicates. Each panel shows the log abundance of ‘non-missing’ and ‘missing’ pY, pS or pT per pair of technical replicates by violin and box plots. On the x-axis, C1, C2 represent two biologically control samples, and D1, D2 represent two biologically samples treated by Dasatinib