
Fig. 5.
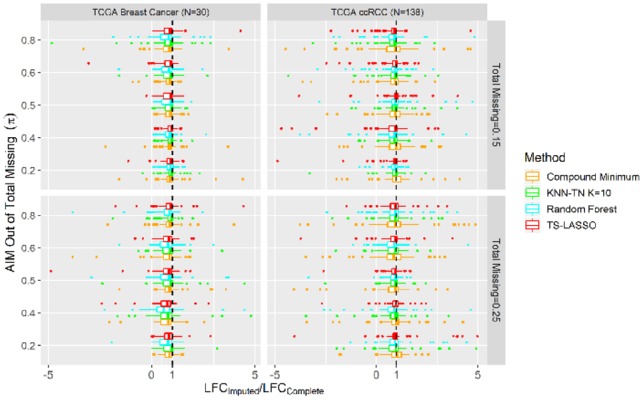
Ratio of LFC between the imputed and complete abundance matrix on TCGA metabolomics data. Ratio >1: LFC enlarged and no change in upregulation; 0<ratio<1: LFC reduced but no change in upregulation; ratio<0: upregulation reversed; ratio=1: no change on LFC