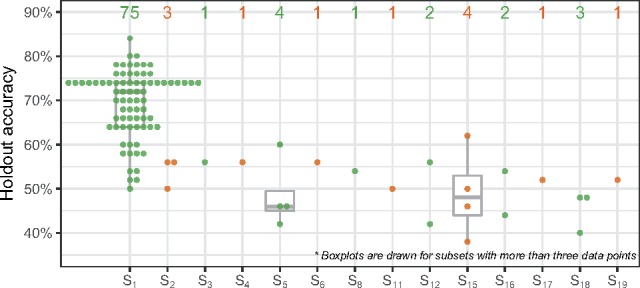
Fig. 3.

TPOT-FSS’s holdout accuracy (vertical) with selected subset (horizontal) in 100 replications on the simulated data. Number of pipeline inclusions of each subset is displayed above the boxplots. Subset S1 is the most frequent to be included in the final pipeline and yields the best prediction accuracy in the holdout set. Alternating colors separate adjacent subsets for better visualization
